How Automated Project Reporting Works in 2026

Automated project reporting is a structured, technology-enabled process that collects project data from connected systems, analyzes it, generates narrative summaries using AI, and delivers formatted updates to stakeholders with minimal manual effort. Project managers who still compile status reports by hand spend hours each week copying data from Jira, Asana, or Monday.com into slide decks or emails. The five-stage pipeline that powers modern automated reporting replaces that manual cycle with a repeatable, auditable system. Tools like Slack, Claude, and no-code automation platforms now make this pipeline accessible to any team, regardless of technical depth.
How automated project reporting works: the five-stage pipeline
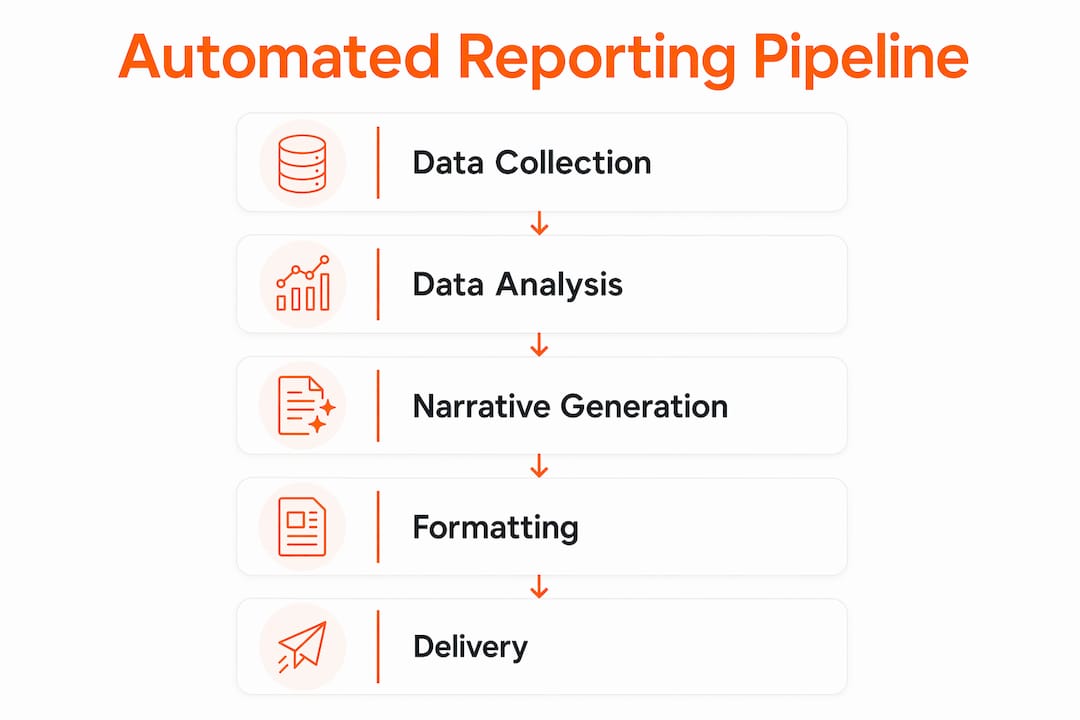
Automated project reporting operates as a modular pipeline. Each stage has a defined input, a defined output, and a clear handoff to the next stage. Understanding this structure is what separates teams that automate successfully from those that build brittle, one-off scripts.
Stage 1: Data collection. The pipeline begins by pulling raw project data from APIs, databases, and activity logs. Tools like Jira Analytics and Asana Analytics expose structured endpoints that return task status, assignee data, due dates, and completion rates. This stage runs on a schedule, typically via cron jobs or a no-code orchestration layer, and produces a normalized data snapshot.

Stage 2: Data analysis. Raw data becomes meaningful through delta computations, trend detection, and anomaly flagging. This is where the system calculates what changed since the last report: tasks completed, milestones slipped, budget variance, and blockers added. A critical best practice here is to pre-compute all math before any AI model touches the data. Large language models are not calculators. Passing raw numbers to an LLM and asking it to compute percentages introduces errors. SQL queries or JavaScript functions handle the math; the LLM handles the words.
Stage 3: Narrative generation. With a clean, pre-analyzed data object in hand, the pipeline calls an LLM such as Claude or GPT-4 with a structured prompt. The prompt includes the computed deltas, the project context, and formatting instructions. The model returns a plain-language summary: what is on track, what is at risk, and what needs attention. Caching intermediate AI drafts at this stage, as recommended in modular pipeline design, reduces redundant API calls and lets teams tune phrasing before enabling auto-send.
Stage 4: Formatting. The narrative output is wrapped into a delivery format. Depending on the audience, this could be an HTML email, a PDF attachment, a Slack block message, or a shared document. Templates control layout, branding, and section order. A fixed report structure covering RAG status, executive summary, milestones, and risks is non-negotiable for scalable automation. Variation in format breaks automation and forces manual intervention every cycle.
Stage 5: Delivery. The formatted report routes to its destination. Email, Slack channels, archive storage, and stakeholder portals are all valid targets. Scheduled delivery runs automatically on Monday mornings or at whatever cadence the team sets, with manual override options preserved for urgent corrections.
Pro Tip: Keep your scheduling logic thin. A cron job or automation trigger should do one thing: fire the pipeline. All business logic, data transformation, and narrative rules belong inside the pipeline stages themselves. This makes troubleshooting faster and failures easier to isolate.
| Stage | Input | Output |
|---|---|---|
| Data collection | APIs, databases, logs | Normalized data snapshot |
| Data analysis | Raw snapshot | Computed deltas and anomaly flags |
| Narrative generation | Analyzed data object | Plain-language summary |
| Formatting | Narrative + template | HTML, PDF, or Slack message |
| Delivery | Formatted report | Stakeholder inbox or channel |
How automation balances machine efficiency with human judgment
The most common fear project managers express about automated reporting is loss of control. That fear is valid but solvable. The answer is a clear separation between what the machine handles and what the human decides.
Automation owns the data layer. Task completion rates, milestone dates, budget snapshots, and risk log entries all feed into the pipeline without human involvement. These are objective facts that do not require interpretation at the collection stage. The system captures them accurately and consistently, every single time.
Humans retain ownership of the judgment layer. RAG status assignments, escalation decisions, and the tone of executive communications all require context that a machine cannot reliably supply. A project that is technically 80% complete but facing a critical dependency blocker is not simply "amber." A project manager reading that situation knows to escalate. An algorithm flagging a percentage threshold does not.
The practical implementation of this balance looks like this:
- Task updates, milestone tracking, and financial snapshots are fully automated inputs.
- AI drafts the narrative summary based on those inputs.
- A project manager reviews the draft, adjusts tone, confirms RAG status, and decides whether to escalate before sending.
- After 3 to 4 weeks of consistent manual review, teams that trust their pipeline can switch to auto-send with confidence.
This phased approach is not optional for teams new to automation. Publishing an incorrect AI-generated update to a senior stakeholder once is enough to destroy confidence in the entire system. The governance ramp-up period is the investment that makes full automation sustainable.
Consistent scheduling and report structure also reduce the volume of ad hoc update requests from stakeholders. When executives know a report arrives every Monday at 9 a.m., they stop sending Friday afternoon Slack messages asking for status. That alone recovers hours of project manager time each week.
Pro Tip: Never let the AI assign RAG status autonomously in the first month. Define explicit threshold rules yourself, review the AI's draft against those rules, and only hand off RAG assignment to the system once you have validated its logic across at least four consecutive reporting cycles.
What real-world automated reporting workflows look like
Understanding the pipeline in theory is useful. Seeing it in practice is more useful. Here are the patterns that appear most frequently in production reporting workflows.
Weekly scheduled reports
The most common implementation is a weekly automated report that runs every Monday morning. A no-code automation platform queries Monday.com, Asana, ClickUp, or Notion via their APIs, passes the data through an analysis function, calls an LLM for the narrative, and delivers the result to a Slack channel and an email distribution list. The entire process runs without human involvement unless a manual override is triggered.
Event-triggered alerts
Calendar-based scheduling covers routine updates. Event-triggered alerts cover exceptions. When a task is marked as blocked, when a milestone date slips, or when budget variance crosses a defined threshold, the system fires an immediate notification. Operational event triggers produce higher-quality, real-time insights than calendar reminders alone because they surface problems at the moment they occur, not seven days later.
Interactive Slack reports
Slack-based reporting has evolved beyond simple text posts. Interactive Slack messages now include drill-down buttons that let managers request detail on specific blocked tasks, threaded replies that pull additional data on demand, and alert buttons that escalate directly to a stakeholder. This turns a static report into a live interface for project intelligence.
Multi-tool data aggregation
Most project teams use more than one tool. A development team might track work in Jira while finance tracks budget in a spreadsheet and leadership reviews milestones in Notion. Automated reporting systems normalize data across these sources into a single snapshot before analysis begins. Without normalization, status labels like "In Progress," "Active," and "Doing" from three different tools create inconsistencies that break the pipeline.
The table below shows how common PM tools map to pipeline stages in a typical multi-tool setup:
| Tool | Pipeline role | Data provided |
|---|---|---|
| Jira | Data collection | Sprint tasks, bug counts, velocity |
| Asana | Data collection | Milestones, task owners, due dates |
| Google Sheets | Data collection | Budget actuals, resource allocation |
| Claude / GPT-4 | Narrative generation | Plain-language summary |
| Slack | Delivery | Channel posts, interactive alerts |
What are the benefits of automated project status reporting?
Teams that implement automated reporting consistently report 50 to 70% time savings on status report compilation. That is not a marginal efficiency gain. On a team where each project manager spends four hours per week on manual reporting, automation recovers two to three hours every single week per person.
The quality improvements are equally significant. Manual reports introduce transcription errors, inconsistent formatting, and missed updates when team members forget to log progress. Automated systems pull directly from the source of truth, apply the same structure every time, and flag anomalies that a human reviewer might overlook at 5 p.m. on a Friday.
Stakeholder satisfaction improves when reports arrive on schedule with a predictable structure. Executives do not want to learn a new format every month. They want to open a report and immediately locate the RAG status, the milestone summary, and the risk register. A fixed template delivered automatically satisfies that expectation without requiring project manager effort.
"AI tools should draft summaries but not replace project manager judgment, preserving accountability." This principle, drawn from automation governance best practices, is the single most important guardrail for teams adopting automated reporting.
Risk detection improves because automated systems monitor data continuously, not just when a project manager has time to review it. Anomaly flags on budget variance or task completion rates surface problems days earlier than a weekly manual review would catch them. Earlier detection means more time to respond before a risk becomes a crisis.
Pro Tip: Measure your automation's effectiveness by tracking two metrics before and after implementation: hours spent on reporting per week and the number of ad hoc stakeholder update requests received. Both numbers should drop significantly within the first month.
Key takeaways
Automated project reporting works because it separates objective data collection from human judgment, runs each stage as a modular pipeline, and delivers consistent outputs on a predictable schedule.
| Point | Details |
|---|---|
| Five-stage pipeline | Every automated reporting system runs through data collection, analysis, narrative generation, formatting, and delivery. |
| Pre-compute before AI | Calculate all deltas and anomalies with SQL or code before passing data to an LLM to prevent calculation errors. |
| Phased governance | Run 3 to 4 weeks of manual review before enabling auto-send to build trust and catch errors early. |
| Fixed report structure | A standardized schema covering RAG status, milestones, and risks is required for repeatable, scalable automation. |
| Measurable time savings | Teams typically recover 50 to 70% of time spent on manual report compilation after full implementation. |
Why most teams get automated reporting wrong on the first try
I have seen a pattern repeat itself across project teams that attempt to automate reporting for the first time. They build the scheduling logic first and treat it as the hard part. It is not. A cron job that fires every Monday is ten lines of configuration. The hard part is everything the cron job calls.
The teams that struggle are the ones that skip schema standardization. They connect three tools, pull data in three different formats, and then wonder why the AI narrative reads like it was written about three different projects. Freezing a canonical report schema before writing a single line of automation code is the single decision that determines whether the system scales or collapses after two weeks.
The other mistake I see consistently is treating the LLM as a data processor. Project managers who are new to AI assume the model will figure out the math if you give it enough context. It will not. It will confidently produce a plausible-sounding number that is wrong. Pre-computing every delta, percentage, and trend before the LLM prompt is not optional. It is the architecture.
What I find genuinely exciting about where this is heading in 2026 is the shift toward autonomous agents that do not just report on project status but query it conversationally. Instead of reading a formatted PDF, a stakeholder asks a question and gets an answer drawn from live project data. That is the direction the best AI agent platforms are moving, and it changes the role of the project manager from report producer to insight curator.
Skopx
See automated project reporting in action with Skopx
Skopx connects to nearly 1,000 integrations and gives project teams a unified interface to query live project data, generate narrative reports, and automate delivery without building a custom pipeline from scratch.
The AI Report Generator handles data ingestion, narrative creation, and formatted output in a single workflow. For teams that need event-triggered intelligence and multi-tool aggregation, Skopx's autonomous AI agents monitor project data continuously and surface anomalies before they become blockers. The AI QA Agent adds an automated validation layer that checks report accuracy before delivery, catching errors that manual review misses. If your team is ready to move from manual status updates to a fully automated reporting pipeline, Skopx is built for exactly that transition.
FAQ
What is automated project reporting?
Automated project reporting is a technology-driven process that collects project data from connected tools, analyzes it, generates narrative summaries using AI, and delivers formatted status updates to stakeholders on a schedule or in response to operational events.
How long does it take to implement automated reporting?
Most teams can configure a basic automated reporting pipeline in one to two weeks, but a phased governance period of three to four weeks of manual review before enabling auto-send is recommended to validate accuracy.
Which tools support automated project status updates?
Project management platforms including Jira, Asana, ClickUp, Monday.com, and Notion all expose APIs that feed automated reporting pipelines. Delivery typically runs through Slack, email, or shared document systems.
What should stay human-controlled in automated reporting?
RAG status assignments, escalation decisions, and executive communication tone should remain under project manager control. Automated systems handle data collection, analysis, and AI-drafted narratives, but final judgment on sensitive updates belongs to a human.
How do you measure the success of automated project reporting?
Track hours spent on manual report compilation and the number of ad hoc stakeholder update requests before and after implementation. Teams typically see 50 to 70% time savings on reporting tasks within the first month.
Recommended
Skopx Team
The Skopx engineering and product team