Augmented Analytics Explained for Business Analysts
Augmented analytics is defined as the use of artificial intelligence, machine learning, and natural language processing to automate data preparation, insight discovery, and explanation inside business intelligence platforms. Platforms like Tableau, IBM Cognos, and Databricks have built these capabilities directly into their core products, making AI-assisted analysis available to every analyst on a team. The result is a fundamental shift: instead of waiting for a data engineer to write SQL, a sales manager can type a question in plain English and receive a chart, a written explanation, and a ranked list of contributing factors within seconds. This article covers how augmented analytics works, how it compares to traditional BI, where it delivers the most value, and what governance requirements you cannot skip.
What is augmented analytics explained: the core definition
Augmented analytics uses AI, machine learning, and NLP to assist with data preparation, insight generation, and explanation inside BI platforms. That definition separates it from earlier business intelligence, which focused on visualizing data that analysts had already cleaned and structured by hand. The "augmented" part means the machine handles the repetitive analytical steps so you can focus on interpretation and action.
The standard industry term is augmented analytics, coined by Gartner in 2017. You will also see it called AI-assisted analytics or automated insight generation, but augmented analytics remains the recognized label across vendors and academic literature.

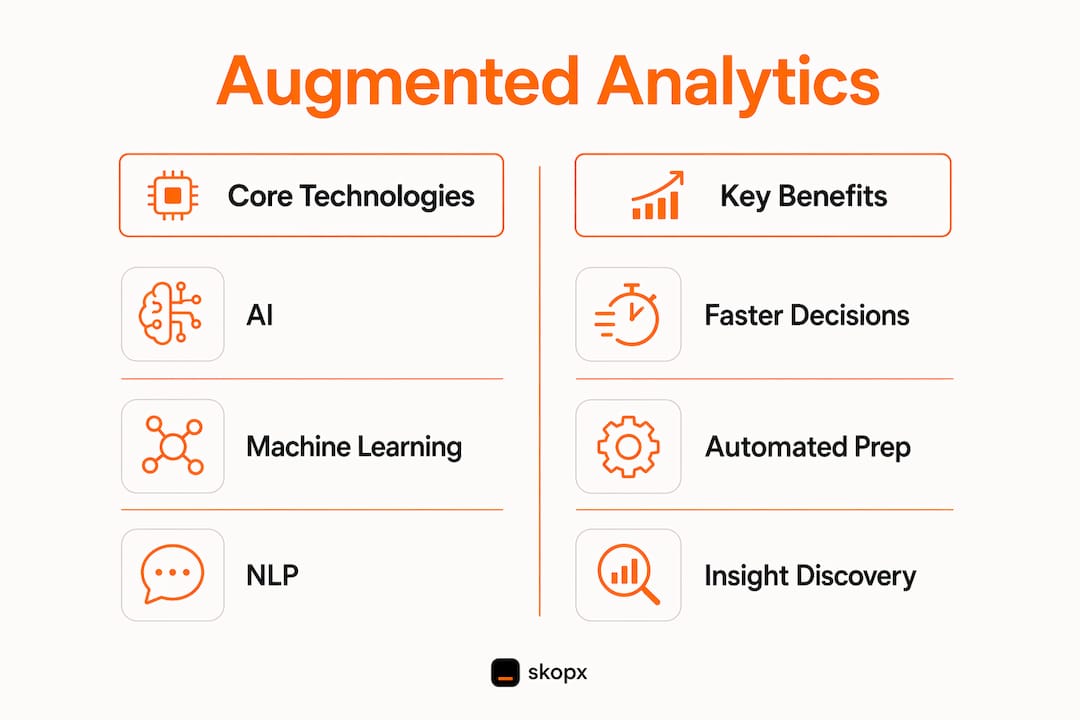
Three capabilities define the category. First, automated data preparation cleans, joins, and profiles datasets without manual scripting. Second, automated insight generation scans data for statistically significant patterns and surfaces the most relevant ones. Third, natural language generation writes a plain-English explanation of what the pattern means and why it matters.
What technologies power augmented analytics?
Machine learning is the engine behind pattern detection. An ML model scans a dataset, identifies correlations, anomalies, and trends, and then ranks them by statistical significance. That ranking is what separates augmented analytics from a standard dashboard: instead of showing you everything, the system shows you what matters most.
Natural language processing handles the input side. Oracle's AI profile feature demonstrates this clearly: a user types a business question in plain English, and the system converts it into a validated SQL query automatically. The analyst never sees the query unless they choose to inspect it. This natural-language-to-SQL pattern is now standard across major platforms.
Natural language generation handles the output side. After the ML model identifies a pattern, a language model writes a sentence explaining it. Instead of reading a bar chart and guessing why Q3 revenue dipped, you read: "Revenue declined 12% in Q3 primarily because enterprise deal closures dropped in the Northeast region." That explanation is generated, not written by a human.
Pro Tip: Before trusting any NLP-generated query, check the SQL it produced. Overlapping data fields and ambiguous column names are the most common sources of incorrect answers in natural-language query tools.
These three technologies work together inside a BI platform. The platform connects to your data sources, the ML layer scans and ranks insights, the NLP layer accepts your questions, and the NLG layer writes the explanations. Tools like Skopx's AI data analytics integrate all three layers into a single interface, removing the need to switch between separate tools for querying, analysis, and reporting.
How does augmented analytics differ from traditional BI?
Traditional BI is descriptive and analyst-dependent. A business user submits a request, a data analyst writes a query, builds a dashboard, and delivers a report. That cycle typically takes days. The business user receives an answer to the question they asked last week, not the question they have today.
Augmented analytics automates data prep, insight discovery, and explanation, enabling business users to get evidence-backed answers without SQL. The shift is not just speed. It changes who can do analysis. A marketing manager with no coding background can explore customer segmentation data directly, without filing a ticket to the analytics team.
| Dimension | Traditional BI | Augmented analytics |
|---|---|---|
| Data preparation | Manual, analyst-coded | Automated by AI |
| Insight generation | Analyst-driven | Machine-ranked and surfaced |
| User interaction | Dashboard consumption | Natural language querying |
| Required skill level | SQL and BI tool expertise | Plain-language questions |
| Speed to insight | Days to weeks | Minutes to hours |
| Explainability | Chart interpretation by user | Written explanation generated |
The table above shows the practical gap. Augmented analytics does not eliminate the analyst role. It removes repetitive manual tasks like cleaning, correlation hunting, and report writing, freeing analysts to focus on interpretation, strategy, and governance.
What benefits and use cases does augmented analytics deliver?
The primary benefit is faster, more accurate decision-making. When a system automatically surfaces the top five drivers of a metric change, a business leader can act on that information in the same meeting where the data is reviewed. That speed compounds over time: teams that make better decisions faster outperform those still waiting for weekly reports.
The second benefit is self-service access for non-technical users. Business users can ask questions in plain language and receive insights with written explanations and visualizations, reducing the need for advanced analytics skills. A regional sales director can query pipeline health, a finance analyst can investigate budget variance, and an operations manager can monitor supply chain anomalies, all without writing a single line of code.
Real-world use cases span every major business function:
- Anomaly detection: Automated alerts flag unusual spikes in customer churn, fraud signals, or inventory shortfalls before they become crises.
- Sales forecasting: ML models analyze historical deal data, seasonality, and rep activity to generate forward-looking revenue projections.
- Customer segmentation: Clustering algorithms identify behavioral groups within a customer base that manual analysis would miss entirely.
- Operational monitoring: Real-time data feeds trigger automated summaries when key performance indicators cross defined thresholds.
Platforms like Tableau and Power BI have embedded augmented analytics features directly into their products. Tableau's Explain Data feature automatically generates statistical explanations for data points a user clicks on. Power BI's Q&A visual accepts natural language questions and returns charts. These are not experimental features. They are production tools used by enterprise teams daily.
Pro Tip: Start augmented analytics adoption with a single, well-governed dataset rather than connecting every data source at once. A no-code self-service analytics platform works best when the underlying data is clean, labeled, and scoped to a specific business question.
What are the critical requirements for implementing augmented analytics?
A governed semantic layer is the single most important precondition for reliable augmented analytics. Incorrect or ungoverned metric definitions lead to wrong interpretations when machines generate answers. If your platform defines "revenue" differently across three data sources, the AI will produce confident-sounding answers that are factually wrong. Fixing that requires human curation of business definitions, not more AI.
Data lineage is the second non-negotiable requirement. Databricks Unity Catalog supports lineage capture and impact analysis for traceability in analytics outputs. That means every AI-generated insight can be traced back to its source table, transformation logic, and the query that produced it. Without lineage, you cannot debug a wrong answer or prove compliance to an auditor.
Explainability separates trustworthy augmented analytics from black-box AI. The output should not just be a number or a chart. It should include a written explanation of what drove the result, what data was used, and what assumptions the model made. Auditability and traceability down to the column level help teams debug AI-driven insights and maintain compliance with data governance policies.
Iterative questioning improves accuracy significantly. Databricks Genie Spaces use compound AI systems that ask clarifying questions before returning visualizations. That follow-up loop prevents the system from making assumptions about ambiguous questions. An analyst who asks "show me top customers" gets a clarifying question: top by revenue, by order volume, or by growth rate? The answer changes the output entirely.
| Implementation requirement | Why it matters | Practical action |
|---|---|---|
| Governed semantic layer | Prevents wrong metric definitions | Define and certify business metrics centrally |
| Data lineage tracking | Enables debugging and compliance | Implement column-level lineage in your data platform |
| Explainable outputs | Builds user trust in AI answers | Require written explanations alongside every visualization |
| Curated datasets | Reduces misinterpretation risk | Scope query surfaces to validated, labeled datasets |
| Iterative question loops | Improves answer accuracy | Use platforms that ask clarifying questions before finalizing results |
Operational success depends on human curation of context and metadata to prevent incorrect assumptions in AI-generated insights. The technology is only as reliable as the governance structure behind it.
Key Takeaways
Augmented analytics delivers reliable, fast insights only when AI automation is paired with governed data, explainable outputs, and human oversight of metric definitions.
| Point | Details |
|---|---|
| Core definition | Augmented analytics uses AI, ML, and NLP to automate data prep, insight discovery, and explanation. |
| Key advantage over traditional BI | Business users get answers in plain language without SQL skills or analyst dependency. |
| Governance is non-negotiable | A governed semantic layer and data lineage are required to prevent AI-generated errors. |
| Explainability builds trust | Every AI-generated insight should include a written explanation and traceable data source. |
| Start small and curated | Limit initial deployments to well-governed, scoped datasets to reduce misinterpretation risk. |
Where augmented analytics is actually headed
The conversation around augmented analytics tends to focus on what the technology can do. The harder question is what organizations are actually ready to do with it.
From working with business teams across industries, the pattern is consistent: the technology is rarely the bottleneck. The bottleneck is data trust. Teams that have invested in clean, governed, well-labeled data get immediate value from augmented analytics tools. Teams that haven't find that the AI confidently produces wrong answers, which erodes trust faster than any manual process ever did.
The most underrated skill in augmented analytics adoption is not prompt engineering or model selection. It is metric governance. Who owns the definition of "active customer" in your organization? If three people give three different answers, no AI system will resolve that disagreement for you. It will just pick one and present it with confidence.
The future direction is clear. Augmented analytics is moving from passive insight delivery toward active decision support. Instead of surfacing a trend and waiting for a human to act, the next generation of tools will propose a specific action, estimate its impact, and execute it if approved. Skopx is already building in this direction, connecting analytics outputs directly to workflow automation across more than 120 integrations. The gap between "here is what the data shows" and "here is what we did about it" is closing faster than most organizations expect.
The teams that will benefit most are not the ones with the most data scientists. They are the ones that have done the unglamorous work of governing their data before the AI arrived.
— Skopx
Skopx for augmented analytics: what's available now
Augmented analytics requires a platform that connects data, generates explainable insights, and puts answers in the hands of every analyst on your team, not just the technical ones.
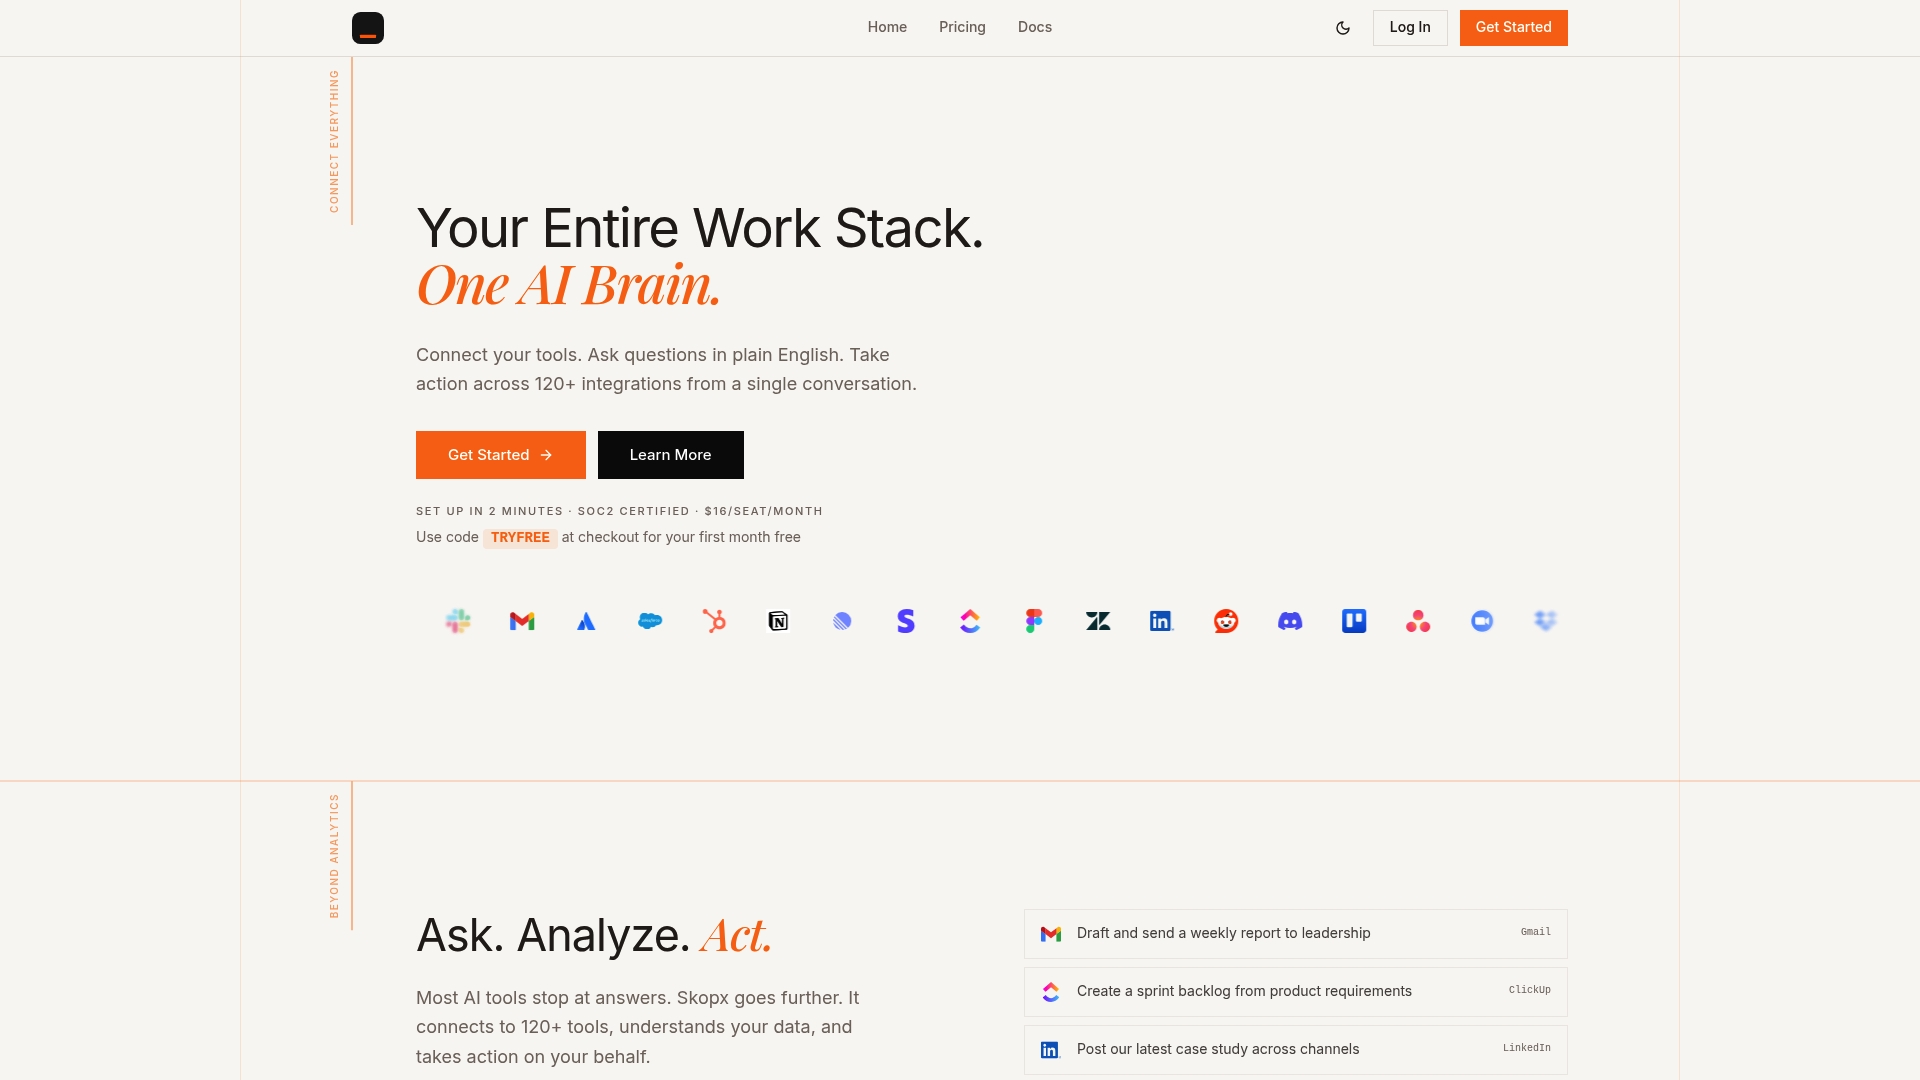
Skopx delivers exactly that through its AI Data Analyst platform and self-service analytics solution, both designed for teams that need answers without writing SQL or building dashboards from scratch. With over 120 integrations, Skopx connects to your existing data sources and lets your team query, analyze, and act on data through a single conversational interface. Every output includes an explanation, not just a chart. If your team is ready to move beyond static dashboards and into real-time, AI-driven analysis, Skopx is built for that next step.
FAQ
What is augmented analytics in simple terms?
Augmented analytics is a technology that uses AI and machine learning to automatically find patterns in your data and explain them in plain language. It removes the need for manual SQL queries or data engineering for routine analysis tasks.
How does augmented analytics differ from standard business intelligence?
Standard BI requires analysts to build queries and dashboards manually. Augmented analytics automates those steps and lets non-technical users ask questions in plain English and receive written, evidence-backed answers.
What are the main risks of augmented analytics?
The primary risk is AI-generated answers based on poorly governed data or undefined metrics, which produce confident-sounding but incorrect results. Governing your semantic layer and implementing data lineage tracking are the two most effective controls.
What are common augmented analytics tools?
Tableau, Power BI, IBM Cognos, Oracle Analytics, and Databricks all include augmented analytics features. Platforms like Skopx extend this further by combining natural language querying with workflow automation across integrated data sources.
Do analysts still have a role when augmented analytics is in place?
Analysts remain critical for governing data definitions, validating AI-generated outputs, and interpreting results in business context. Augmented analytics removes repetitive tasks but does not replace human judgment on what the data means for the organization.
Recommended
Skopx Team
The Skopx engineering and product team