Monitor All Integrations in a Single Dashboard
A unified integration monitoring dashboard is defined as a centralized interface that aggregates status, performance, and alert data from multiple APIs, SaaS tools, and cloud services into one view. Project managers, data analysts, and IT professionals who need to monitor all integrations in a single dashboard gain something fragmented toolsets cannot deliver: a complete picture of system health without switching between screens. Specialized platforms can track 140–450+ providers simultaneously, with update intervals ranging from every 60 seconds to once per hour. That scale makes centralized monitoring a practical necessity, not a convenience.
What tools and technologies enable monitoring all integrations from a single dashboard?
The right tool category depends on your infrastructure model. Cloud-native dashboards connect directly to SaaS APIs without requiring software installs on your servers. Containerized platforms run as lightweight services inside your existing infrastructure. Agent-less connectors pull data at the API level, skipping the need for SDKs in every application. Each model has a different tradeoff between setup speed and depth of visibility.
Containerized observability platforms consolidate errors, uptime, logs, and AI tracing into a single deployment. A single container can replace up to five distinct monitoring tools and operate with as little as 512 MB of RAM while supporting dozens of integrations. That efficiency matters when your team is managing dozens of connected services and cannot afford the overhead of running separate monitoring stacks.

Some infrastructure monitoring platforms support dozens of integrations with real-time dashboards refreshed every five seconds, including health bars, anomaly detection, and mobile responsiveness. That refresh rate is fast enough to catch failures before users report them.
The table below compares key feature categories across common dashboard types.
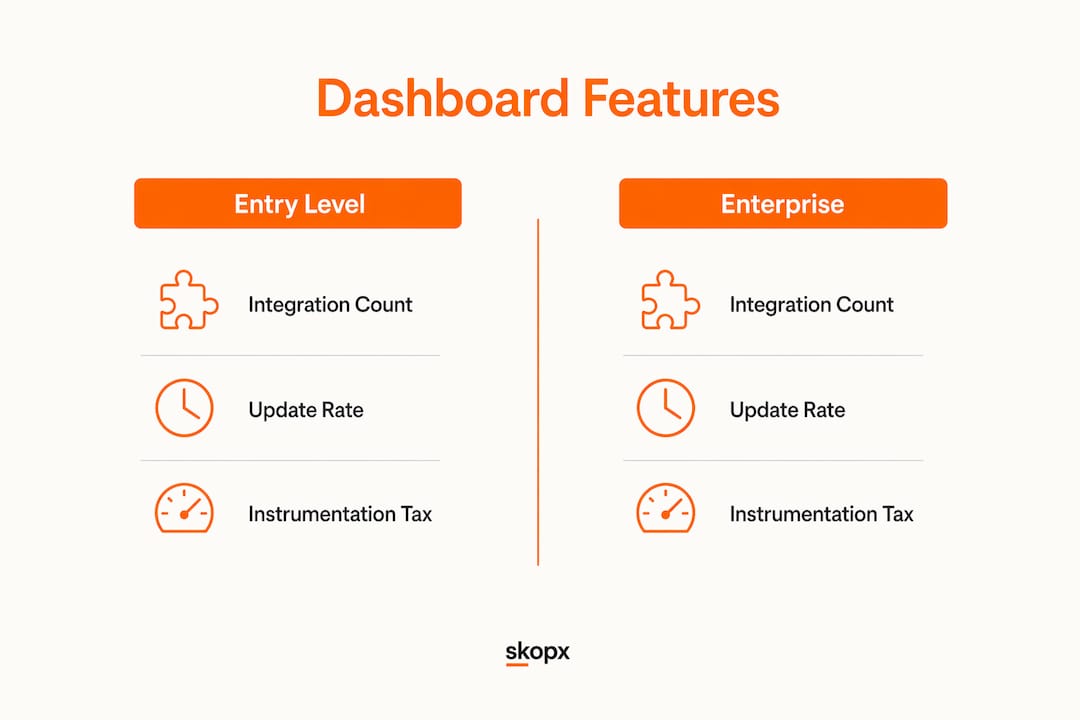
| Feature category | Entry-level monitoring apps | Enterprise platforms |
|---|---|---|
| Integration count | Up to 40 | 140–450+ |
| Update frequency | Every 60 seconds | Every 5–60 seconds |
| Historical data windows | 24h, 7d | 24h, 7d, 30d, 90d |
| AI agent tracing | Not included | Intent and action traces |
| Deployment model | SaaS only | Cloud, container, agent-less |
Pro Tip: Prioritize tools with low instrumentation tax. Agent-less connectors that collect data at the API level can shorten your time-to-value from weeks to a single afternoon.
How to set up a centralized dashboard to monitor all your integrations
Setup follows a clear sequence. Skipping steps early creates gaps that surface as blind spots later.
- Identify your data sources. List every API, cloud service, SaaS tool, and AI agent your team depends on. Group them by criticality: revenue-impacting services first, supporting tools second.
- Gather API credentials and access rights. Each integration requires authentication. Collect API keys, OAuth tokens, or service account credentials before you begin connecting sources.
- Connect your highest-priority integrations first. Agent-less API connectors reduce setup friction significantly. Start with five to ten critical services and confirm their status feeds are accurate before expanding.
- Configure real-time update intervals. Set refresh rates based on integration criticality. Revenue-critical APIs warrant five-second polling. Lower-priority services can update every 60 seconds without meaningful risk.
- Set historical data windows. Enterprise dashboards support time windows of 24h, 7d, 30d, and 90d. Longer windows enable correlation analysis when diagnosing recurring failures.
- Build dependency maps. Document which services depend on which. Dependency mapping identifies bottlenecks before they reach users and is the foundation of proactive governance.
- Define alert rules. Set thresholds for latency, error rates, and cost. Alerts should fire before a failure becomes user-visible, not after.
The table below shows a typical dashboard layout for a team managing dozens of integrations.
| Dashboard panel | What it shows | Update rate |
|---|---|---|
| Integration health grid | Status of all connected services | Every 5–60 seconds |
| Error rate chart | Errors per integration over time | Every 5 seconds |
| Dependency map | Service relationships and failure paths | On-demand |
| Cost tracker | Token usage and API spend | Hourly |
| Alert log | Recent threshold breaches | Real-time |
Pro Tip: Start with your five most critical integrations and expand gradually. A dashboard with ten well-configured sources beats one with fifty poorly configured ones.
What are common challenges when monitoring multiple integrations?
Data fragmentation is the primary challenge in multi-integration environments. When each tool reports status in a different format or at a different interval, your dashboard shows inconsistent data. Centralization shifts teams from reactive firefighting to proactive governance by forcing a single source of truth.
Instrumentation overhead is the second major problem. Installing monitoring agents in every application adds complexity and slows deployment. Agent-less connectors solve this by collecting data at the API level, removing the need for per-app installs entirely.
AI agent monitoring adds a layer that basic uptime checks cannot cover. Tracking autonomous agents requires monitoring agent intent, action traces, and validating authorized tool calls. Circuit breakers automatically stop failing agents when cost, latency, or error thresholds are crossed. This prevents cascading failures where one runaway agent consumes resources across your entire stack.
Common troubleshooting practices that reduce operational risk:
- Normalize update intervals. Align all integrations to a consistent polling schedule to prevent stale data from mixing with live data.
- Set cost thresholds for AI agents. Token usage spikes are the most common cause of unexpected failures in AI-integrated workflows.
- Use dependency maps during incidents. When one service fails, the map shows which downstream services are at risk before they fail too.
- Test alert rules monthly. Alerts that fire too often get ignored. Alerts that never fire miss real problems. Calibrate thresholds regularly.
- Log action traces for AI agents. Uptime alone does not confirm an agent is working correctly. Action traces show whether the agent completed its intended task.
Pro Tip: Build circuit breaker logic into any workflow that involves AI agents. A single misconfigured agent can exhaust API budgets in minutes without an automatic stop mechanism.
How does centralized monitoring improve team collaboration and decisions?
A unified view of integration health changes how teams communicate. When project managers, analysts, and engineers all see the same dashboard, conversations shift from "is it down?" to "why did latency spike at 2:00 AM?" That shift is the difference between reactive and proactive operations.
Historical correlation analysis is where dashboards deliver the most underappreciated value. A 90-day view of error rates across integrations reveals patterns that a 24-hour view hides entirely. Teams use this data for capacity planning, vendor negotiations, and identifying which integrations consistently underperform.
AI agent monitoring adds a new dimension to collaboration. When autonomous agents handle tasks across multiple systems, teams need to verify that agents are completing authorized actions, not just running without errors. Dashboards that surface agent intent and action quality give teams the confidence to expand automation without losing oversight.
Collaboration workflows that centralized dashboards enable:
- Shared incident response. All teams see the same alert simultaneously, reducing the time spent diagnosing who owns the problem.
- Cross-team capacity reviews. Monthly reviews of historical data identify which integrations are approaching limits before they cause failures.
- Vendor performance reporting. Exportable uptime data supports contract reviews and SLA enforcement.
- Autonomous workflow audits. AI agent action traces give compliance and security teams a record of what agents did and when.
The practical result is that teams spend less time in reactive incident calls and more time on planned improvements. That shift compounds over time as the organization builds institutional knowledge from historical data.
Key Takeaways
A centralized integration monitoring dashboard is the most direct path from reactive incident response to proactive system governance.
| Point | Details |
|---|---|
| Start with critical integrations | Connect your five most important services first and verify accuracy before expanding. |
| Use agent-less connectors | API-level data collection cuts setup time from weeks to hours with no per-app installs. |
| Set historical data windows | Use 30d and 90d views to find recurring failure patterns and support capacity planning. |
| Add circuit breakers for AI agents | Automatic thresholds prevent runaway token usage and cascading failures across workflows. |
| Centralize for collaboration | A shared dashboard replaces siloed status checks and gives all teams one source of truth. |
The part most teams skip until it's too late
The Skopx Team has worked with project managers and IT leads who built dashboards covering dozens of integrations, only to discover six months later that their AI agents were the least-monitored part of the stack. Uptime metrics looked fine. Costs were climbing. No one had set action traces or cost thresholds because the agents "seemed to be working."
That gap is where modern integration monitoring is evolving fastest. Basic uptime checks were sufficient when integrations were passive data pipes. Autonomous agents that make decisions, call external APIs, and trigger downstream workflows require a fundamentally different level of scrutiny. Intent verification and action tracing are not optional extras. They are the minimum standard for any team running AI-assisted workflows in production.
The other pattern worth naming: teams that start with too many integrations at once rarely finish the setup correctly. A dashboard with 80 poorly configured sources gives you noise, not insight. The teams that get the most value start narrow, validate their data, and expand deliberately. That discipline is harder than it sounds when stakeholders want everything visible immediately.
The tools exist to do this well. Containerized platforms, agent-less connectors, and circuit breaker logic are all available without enterprise-level budgets. The limiting factor is almost always process, not technology. Build the habit of reviewing historical data weekly, calibrating alert thresholds monthly, and auditing agent action traces before they become a problem.
Skopx Team
How Skopx supports centralized integration monitoring
Teams that want to move beyond basic dashboards and into AI-driven integration management have a direct path with Skopx.
Skopx connects with nearly 1,000 integrations and lets teams query data and trigger actions from a single interface. The AI consulting services help organizations design monitoring architectures that fit their existing stack, from initial setup through alert configuration and agent governance. Skopx is autonomous where it is safe to be: the insights engine monitors your connected tools continuously, flags anomalies, and delivers an automatic morning briefing every day, while actions that touch your systems, like sending a Slack message or filing a GitHub issue, run on your instruction. The result is a monitoring setup that covers both traditional integrations and modern AI-driven workflows without requiring separate tooling for each.
FAQ
What does it mean to monitor all integrations in a single dashboard?
It means aggregating status, performance, and alert data from all connected APIs, SaaS tools, and cloud services into one interface. This eliminates the need to check multiple tools separately and gives teams a unified view of system health.
How many integrations can a centralized dashboard handle?
Specialized platforms can monitor 140–450+ providers simultaneously, with update intervals ranging from every 60 seconds to once per hour depending on integration type.
What is instrumentation tax and why does it matter?
Instrumentation tax is the overhead of installing monitoring agents in every application. Agent-less connectors collect data at the API level instead, cutting deployment time from weeks to hours.
How do circuit breakers protect integration monitoring setups?
Circuit breakers automatically stop failing agents or services when cost, latency, or error thresholds are crossed. This prevents one failing component from cascading into broader system failures.
How does a unified dashboard improve team collaboration?
A shared dashboard gives project managers, analysts, and engineers the same real-time view, replacing siloed status checks with a single source of truth that supports faster incident response and better capacity planning.
Share this article
Skopx Team
The Skopx engineering and product team