Cross-Platform Data Insights: Real Examples That Work
![]()
Cross-platform data insights are defined as the practice of integrating data from two or more separate systems to produce a unified view that no single source can provide alone. The industry term for this practice is multi-source analytics, though "cross-platform data insights" describes the same concept in business contexts. For data professionals and business analysts, the most useful examples of cross-platform data insights come from real deployments: Google BigQuery Gemini querying joined tables with natural language, Adobe's Data Insights Agent generating live visualizations, and Verizon Connect converting 500 million daily IoT data points into fleet intelligence. Each example below shows a different implementation pattern, so you can identify which approach fits your organization's needs.
1. What are the best examples of cross-platform data insights?
The strongest examples share one trait: they replace manual data stitching with automated, query-ready integration. The sections below cover AI querying, centralized dashboards, multi-touch attribution, and operational IoT analytics. Each represents a distinct architecture for cross-platform data analysis.

2. AI-powered natural-language querying across datasets
Natural-language querying removes the SQL barrier between business analysts and their data. Google BigQuery Gemini generates relationship graphs that map row-level connections across tables, enabling detection of patterns and anomalies without manual joins. A practical example: an analyst asks which customers subscribe to multiple premium services, and Gemini traces that relationship across two separate tables automatically.
The underlying mechanism is a relationship graph approach that models rows as nodes and edges, letting AI agents answer multi-hop questions across related datasets without writing a single line of SQL. That architecture matters because most enterprise data lives in separate tables with implicit relationships that only experienced engineers know how to join.
Adobe's Data Insights Agent takes a similar approach on the marketing side. Adobe's agent responds to natural-language prompts like "Show revenue by region" or "What were my top 10 SKUs by profit in march?" with visualizations that update dynamically as you refine the question. The result is iterative exploration rather than a static report.
- Analysts reduce time spent on manual query writing.
- Business teams gain self-service access to cross-platform data without engineering support.
- Visualizations update in real time as prompts are refined.
- Anomaly detection surfaces patterns that scheduled reports miss.
Pro Tip: Start with a prompt that crosses two data sources you already trust. If the result matches what you know manually, you have confirmed the relationship graph is accurate and can extend queries to less familiar datasets.
3. Centralized dashboards unifying multi-channel marketing data
A centralized dashboard is the most common architecture for multi-platform data insights in marketing teams. Data Pivot built a cross-platform paid media command center that unified data from 7 paid acquisition channels into a single model with dynamic KPI switching. The result was instant executive visibility across 721 million impressions, with budget reallocation decisions based on cross-channel comparisons rather than channel-siloed reports.
The da-lytics example goes further. Their Power BI dashboard consolidates campaign data from 8 platforms, including TikTok, YouTube, and Google Ads, into one reporting view for a media agency. Executives can compare cost per acquisition across all 8 channels in a single screen without toggling between platform-native dashboards.
KPI normalization is the technical requirement that makes these dashboards work. Without consistent definitions, "impressions" on TikTok and "reach" on Meta are not comparable. Consistent data grain across platforms is the prerequisite for meaningful cross-channel comparisons. Skip normalization and the dashboard becomes misleading rather than clarifying.
| Dashboard example | Platforms unified | Key output |
|---|---|---|
| Data Pivot command center | 7 paid acquisition channels | 721 million impressions, dynamic KPI switching |
| da-lytics Power BI | 8 platforms (TikTok, YouTube, Google Ads, and more) | Unified campaign reporting for media agency |
| M365UsageAnalytics | Microsoft Purview audit logs plus Entra ID profiles | Licensing and enablement decisions by user tier |
- Define KPIs before building the data model, not after.
- Use a single data grain (daily, weekly) across all source feeds.
- Build dynamic KPI switching so executives can shift views without requesting new reports.
- Identify the highest ROI campaigns by comparing normalized cost metrics across channels.
4. Multi-touch attribution and behavioral analytics
Last-click attribution is the most common mistake in cross-platform advertising analysis. GA4's Conversion Paths report maps customer interactions across channels and assigns fractional credit to every touchpoint along the journey. That fractional credit prevents budget cuts to channels that assist conversions but never close them.
GA4's data-driven attribution model also supports segment overlap and funnel reports, giving analysts a view of where conversion drop-offs occur across the full cross-channel path. A paid social campaign that looks unprofitable in a last-click view often shows strong assist credit in a multi-touch model. That difference can reverse a budget decision.
On the enterprise side, the M365UsageAnalytics template combines Microsoft Purview audit logs with Entra ID user profiles to produce usage insights segmented by user tiers. Merging behavioral telemetry with identity and licensing data produces insights that raw usage metrics alone cannot deliver. An IT team can identify which user segments are underusing licensed features and redirect enablement resources accordingly.
Pro Tip: Run GA4's Conversion Paths report for a 90-day window before making any channel budget decisions. The longer window captures slow-converting paths that a 30-day view misses entirely.
- Map the full customer journey before assigning budget weight to any single channel.
- Use data-driven attribution in GA4 rather than the default last-click model.
- Combine identity data with behavioral telemetry for enterprise licensing decisions.
- Audit funnel drop-off points across channels to find where cross-platform friction occurs.
5. Operational and IoT data insights at scale
Operational data insights represent the most demanding form of cross-platform analysis. Verizon Connect implemented agentic AI to convert 500 million daily IoT data points into actionable fleet insights, including increased harsh braking trends and idling time patterns. The system scales to 100,000 users, a scale that static dashboards and rule-based alerts cannot match.
The key difference between agentic AI and a traditional dashboard is adaptive pattern detection. A dashboard shows you what you configured it to show. An agentic system detects patterns you did not anticipate and surfaces them without a predefined rule. For fleet management, that means catching a regional driving behavior shift before it becomes a safety incident.
"Agentic AI approaches offer dynamic pattern detection that surpasses static dashboards by adapting analysis based on discovered patterns, vital in unpredictable operational domains." — AWS Machine Learning Blog on Verizon Connect
The Verizon Connect case also demonstrates the operational intelligence principle: data from GPS sensors, engine telemetry, and driver behavior logs are separate streams that only produce insight when combined. No single stream answers the question "Why did fuel costs rise in the northeast region last quarter?" The answer requires joining location data, idling logs, and route efficiency metrics.
- Agentic AI detects patterns outside predefined rules, unlike static dashboards.
- Combining GPS, engine, and behavior data produces insights no single stream can provide.
- Real-time pattern detection enables proactive decisions rather than reactive reporting.
- Scale to 100,000 users requires automated insight delivery, not manual report generation.
Key takeaways
Cross-platform data insights deliver their highest value when AI querying, normalized KPI dashboards, and multi-touch attribution are combined into a single analytical framework rather than deployed in isolation.
| Point | Details |
|---|---|
| AI querying removes SQL barriers | Tools like BigQuery Gemini and Adobe's agent let analysts query joined datasets with plain language. |
| KPI normalization is non-negotiable | Consistent data grain across platforms is the prerequisite for accurate cross-channel comparisons. |
| Multi-touch attribution prevents budget errors | GA4's Conversion Paths assigns fractional credit, stopping cuts to channels that assist conversions. |
| Agentic AI scales operational analysis | Verizon Connect processes 500 million daily data points with adaptive pattern detection at 100,000 users. |
| Identity plus behavior equals enterprise insight | M365UsageAnalytics shows that merging telemetry with user profiles produces licensing decisions raw metrics cannot. |
What I've learned building cross-platform analytics programs
The biggest mistake I see organizations make is treating cross-platform analytics as a technology problem. They buy a new tool, connect a few APIs, and expect insight to appear. It does not. The real work is definitional: agreeing on what "conversion" means across Google Ads, Meta, and your CRM before a single query runs.
The second mistake is building dashboards for executives before validating data with analysts. Executives see a number and act on it. Analysts know that the TikTok "view" metric is not the same as a YouTube "view." That definitional gap produces decisions based on false comparisons. Fix the data model first, then build the executive view.
What actually works is a two-layer approach. The first layer is a normalized data model with agreed definitions, consistent grain, and documented source logic. The second layer is an AI querying interface that lets analysts and business teams explore that model without writing SQL. The AI-driven analytics pattern works because it separates data governance from data access. Governance lives in the model. Access lives in the query interface.
For teams new to cross-platform analysis, start with two sources, not eight. Unify your CRM and your primary ad platform. Validate every metric manually before trusting the automated output. Then add a third source once the two-source model is stable. Expanding too fast produces a dashboard that nobody trusts, which is worse than no dashboard at all.
— Skopx
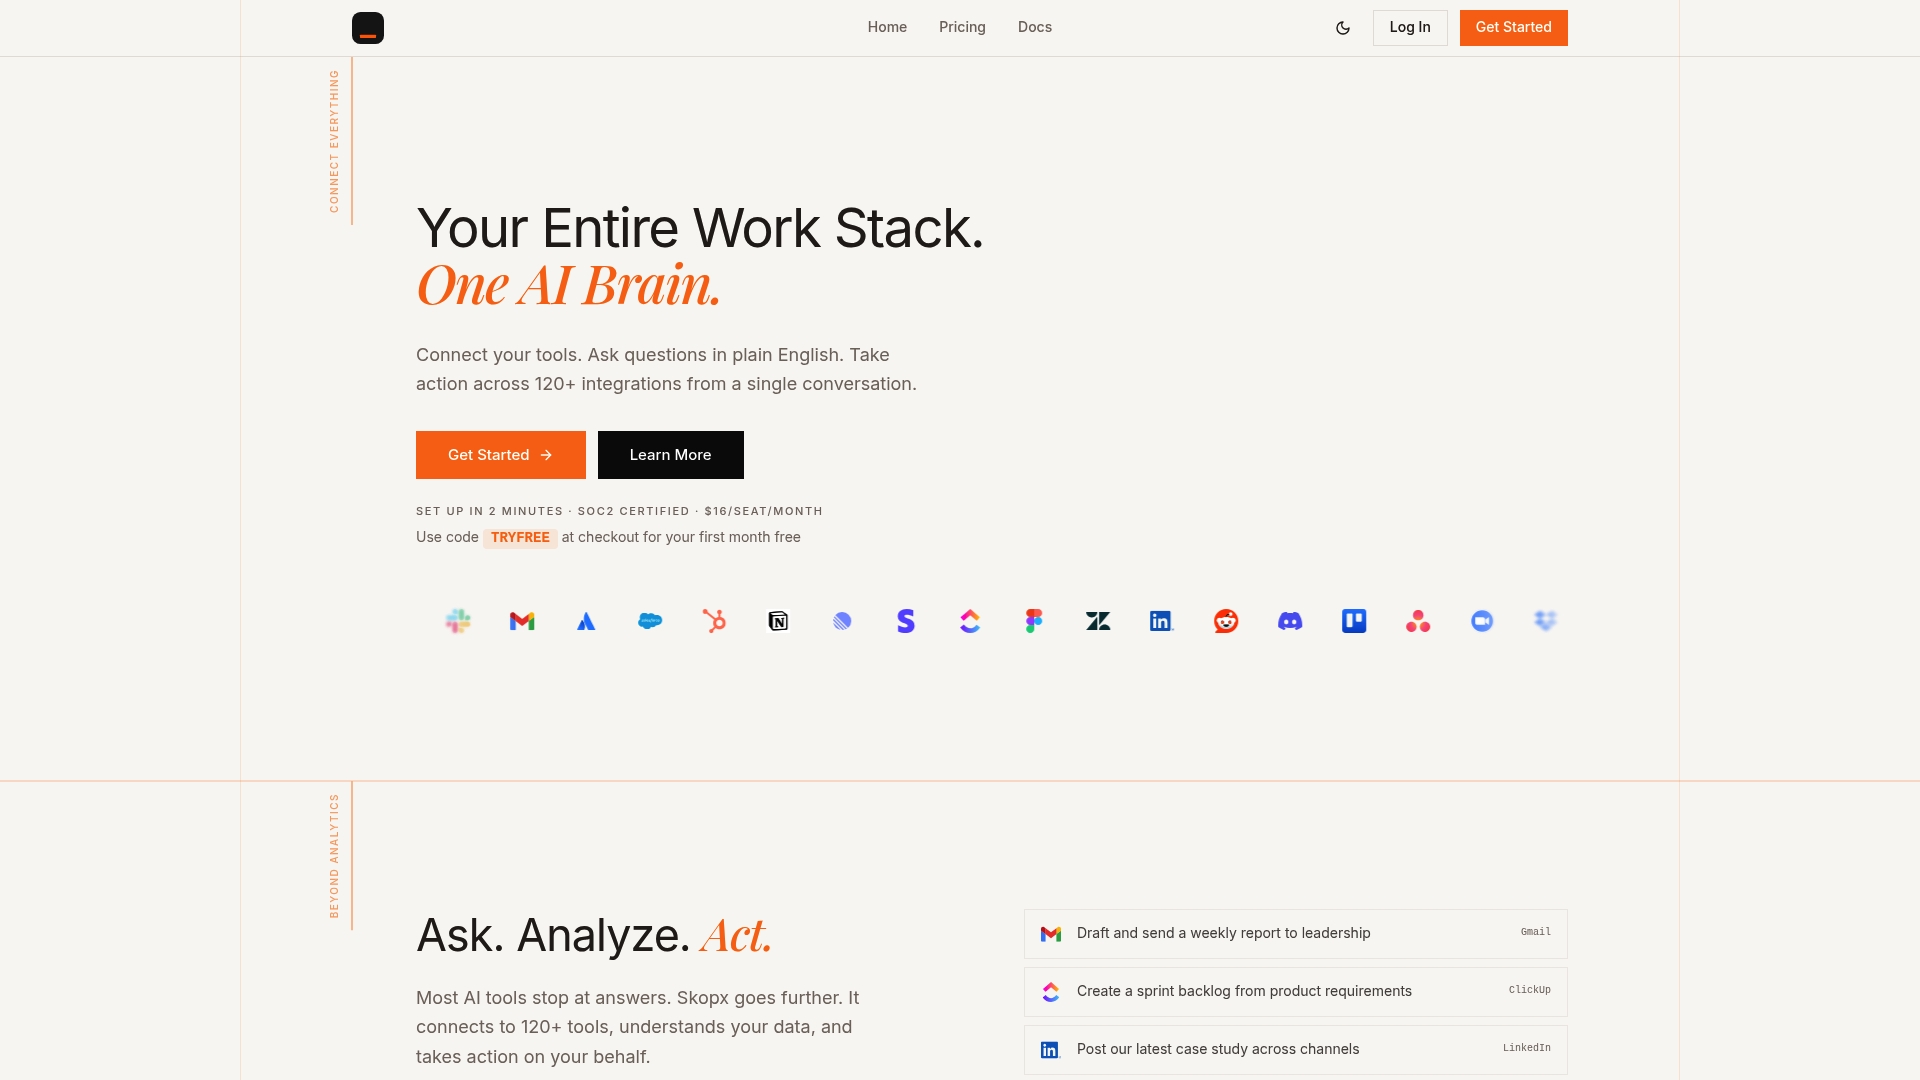
Skopx connects your data sources into one queryable workspace
Skopx connects with over 120 integrations, letting your team query data across all of them from a single interface without writing SQL or switching between tools. The AI Data Agent answers complex, multi-source questions in plain language and returns results with context, not just numbers.
For teams scaling their agentic AI workflows, Skopx automates insight delivery so analysts spend time on decisions rather than data preparation. The platform also supports operational intelligence use cases where real-time, multi-source analysis is required at scale. If your team is ready to move beyond static dashboards, Skopx is built for exactly that transition.
FAQ
What are cross-platform data insights?
Cross-platform data insights are unified findings produced by combining data from two or more separate systems. The goal is to answer questions that no single data source can address alone.
How does GA4 support cross-platform data analysis?
GA4's Conversion Paths report maps customer interactions across channels and assigns fractional credit to every touchpoint using data-driven attribution. This prevents overreliance on last-click metrics that misrepresent channel contribution.
What is KPI normalization in multi-platform dashboards?
KPI normalization means defining each metric consistently across all data sources before combining them. Without it, comparing "impressions" from TikTok and "reach" from Meta produces misleading cross-channel conclusions.
How did Verizon Connect use agentic AI for operational insights?
Verizon Connect deployed agentic AI to process 500 million daily IoT data points and surface fleet insights like harsh braking trends and idling patterns. The system scales to 100,000 users with adaptive pattern detection that static dashboards cannot replicate.
Can analysts query cross-platform data without writing SQL?
Yes. Tools like Google BigQuery Gemini and Adobe's Data Insights Agent accept natural-language prompts and return visualizations or answers by querying joined datasets automatically. Skopx offers the same capability across 120-plus integrations.
Recommended
Skopx Team
The Skopx engineering and product team