Why Traditional BI Tools Fall Short for Analysts

Traditional business intelligence (BI) is defined as software that collects, processes, and presents historical data through static dashboards and pre-built reports. Tools like Tableau, Power BI, and Looker dominate this category. The core reason why traditional BI tools fall short is architectural: they were built for slow reporting cycles, not the real-time, ad-hoc analysis that modern organizations demand. The result is a system that answers "what happened" but rarely explains "why," leaving analysts buried in backlog and decision-makers acting on stale data.
Why traditional BI tools fall short on speed and agility
Traditional BI tools create a 4–7 day lag between a business question and an actionable answer. That gap exists because most legacy systems rely on batch processing, meaning data is ingested and transformed on a schedule, not continuously. By the time a report surfaces, the market condition it describes may have already changed.

The practical damage is real. A marketing team running a paid campaign cannot wait a week to learn whether a creative change lifted conversions. A sales leader cannot adjust territory strategy based on last Tuesday's pipeline snapshot. Every day of delay is a day the organization operates on incomplete information.
Analyst queue backlogs make this worse. When business users cannot self-serve, every data question routes through an analyst. That analyst manages competing priorities, and the requester waits. The analyst bottleneck is an architecture problem, not a staffing problem. Traditional BI was never designed to support on-demand querying at scale.
"The analyst bottleneck is not a sign that your team is understaffed. It is a sign that your architecture was built for monthly reporting, not daily decisions."
Pro Tip: Before hiring another analyst to clear the backlog, audit how many requests are repetitive queries that a self-service layer could answer automatically. The answer usually surprises teams.
Why do so many business users never open their BI tools?
90% of traditional BI licenses go unused because the tools are too complex for the average business user. Adoption rates sit at roughly 25% in most enterprises. That means three out of four licensed seats generate no return.
The complexity barrier is structural, not cosmetic. Business users in finance, marketing, or operations are not trained in SQL, data modeling, or dimensional logic. Tools like Tableau and Power BI require meaningful technical fluency to build or modify reports. Without that fluency, users depend on analysts for every new question.
The downstream effects compound quickly:
- Analyst dependency: Every data question requires a ticket, a wait, and a handoff.
- Governance gaps: When users build their own workarounds in spreadsheets, data definitions fragment across the organization.
- Cost waste: Unused licenses, duplicate dashboards, and redundant data pulls burn budget without producing insight.
- Eroded trust: When different teams pull different numbers from the same system, confidence in the data collapses.
Dashboard sprawl generates excessive licensing costs and conflicting data definitions that erode trust in analytics results. "Zombie dashboards," built for one-time requests and never retired, clutter BI ecosystems and consume resources without producing ROI.
Pro Tip: Run a dashboard audit quarterly. Flag any report that has not been viewed in 90 days. Retiring zombie dashboards reduces noise, cuts costs, and forces clarity about which metrics actually drive decisions.
How rigid semantic layers break under real-world data changes
The semantic layer is the translation engine between raw data and the reports users see. In traditional BI, this layer is hand-coded and tightly coupled to specific field names, table structures, and pipeline logic. When the underlying data changes, the semantic layer breaks.
When CRM fields or data pipelines change, traditional BI semantic layers require 2–4 weeks of manual reconstruction to restore accuracy. That is not a minor inconvenience. It means every report built on that layer returns incorrect data until the rebuild is complete.
The sequence of failure looks like this:
- A CRM administrator renames a field (for example, "Deal Stage" becomes "Opportunity Status").
- The semantic layer loses its mapping and begins returning null values or errors.
- An analyst identifies the break, logs a ticket, and begins manual reconstruction.
- Reports remain inaccurate or unavailable for days or weeks.
- Business users lose confidence in the data and revert to spreadsheets.
Dashboard tools are just a consumption layer. The real problems of cost, accuracy, and governance live in the data warehouse and semantic layers beneath them. Adding a new dashboard without fixing the architecture moves data silos into a prettier format. It does not solve the underlying fragility.
The backlog effect is cumulative. Each rebuild cycle pulls analysts away from new requests. Each delay adds to the queue. Each queue addition increases the pressure to rush the next rebuild, which introduces new errors.
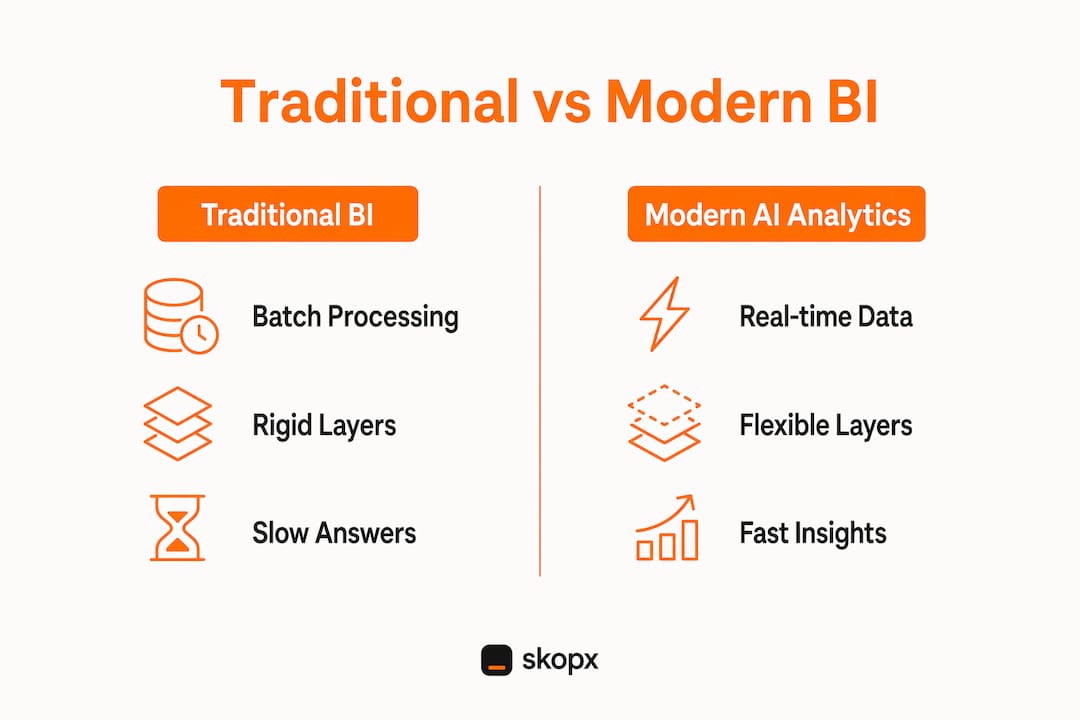
Traditional BI tools vs. modern AI-powered analytics
The limitations of traditional BI become clearest when placed next to what modern AI-powered analytics can do. The gap is not about interface design. It is about what the architecture can reason over and how fast it can respond.
Retrofitting AI onto legacy BI dashboards only changes the interface, not the underlying logic. Legacy architectures cannot correlate structured and unstructured data dynamically, which limits AI's effectiveness to surface-level pattern matching. True AI-driven analytics requires re-architecting the data layer, not adding a chatbot to an existing dashboard.
Traditional BI tools focus on "what happened" rather than "why," leaving business users dependent on intuition for real-time decisions. Modern AI analytics platforms answer both questions in the same query.
| Feature | Traditional BI | Modern AI analytics |
|---|---|---|
| Data freshness | Batch, hours to days old | Real-time or near real-time |
| Query method | Pre-built dashboards, SQL | Conversational, natural language |
| User access | Analyst-dependent | Self-service for all roles |
| Insight depth | Descriptive ("what happened") | Diagnostic and predictive ("why and what next") |
| Maintenance burden | High, manual semantic rebuilds | Low, adaptive data models |
| Unstructured data | Not supported | Integrated and correlated |
BI environments with mixed legacy and modern tools produce integration challenges, fragmented knowledge, and slower insights. The hybrid approach increases complexity rather than resolving it. Organizations that bolt modern tools onto legacy foundations end up with two sets of problems instead of one.
The organizations seeing the most improvement are those that treat analytics as a data intelligence function, not a reporting function. That shift changes what questions get askedwho can ask them, and how fast answers arrive.
Pro Tip: When evaluating a modern analytics platform, test it with a question your current BI tool takes more than two days to answer. The speed difference will tell you more than any feature comparison sheet.
Key Takeaways
The core failure of traditional BI is architectural: batch processing, rigid semantic layers, and analyst-dependent workflows combine to make timely, self-service analytics structurally impossible.
| Point | Details |
|---|---|
| Architecture drives delays | A 4–7 day lag between questions and answers comes from batch processing, not slow analysts. |
| Low adoption wastes budget | 90% of BI licenses go unused because tools require technical skills most business users do not have. |
| Semantic layers are fragile | A single CRM field rename can trigger a 2–4 week manual rebuild, breaking reports across the organization. |
| AI retrofits do not fix the root cause | Adding AI to a legacy dashboard changes the interface but not the underlying data logic. |
| Modern analytics answers "why" | AI-powered platforms correlate structured and unstructured data in real time, replacing intuition with evidence. |
The architecture problem no one wants to admit
At Skopx, we have seen organizations spend months debating which dashboard tool to switch to, when the dashboard was never the problem. The problem was always the layer below it.
Most BI failures trace back to two decisions made years earlier: choosing a rigid semantic layer and accepting batch data pipelines as the default. Both decisions made sense when monthly reporting was the goal. Neither makes sense when the business needs answers in hours.
The uncomfortable truth is that most "BI modernization" projects are cosmetic. They replace Tableau with a newer tool, add a natural language search bar, and call it transformation. The data warehouse stays the same. The semantic layer stays the same. The analyst bottleneck stays the same. Six months later, the complaints are identical.
What actually works is treating the analytics architecture as a product, not infrastructure. That means continuous iteration, user feedback loops, and a genuine commitment to self-service. It also means retiring the idea that analysts should be the gatekeepers of data. Their value is in interpretation and strategy, not in running the same query for the fifteenth time.
The organizations that get this right stop asking "how do we improve our BI tool" and start asking "how do we make every team member a capable data user." That question leads to very different architectural choices.
— Skopx
How Skopx addresses the gaps traditional BI leaves behind
Traditional BI creates delays, dependency, and fragility. Skopx was built to eliminate all three.
Skopx connects to over 120 integrations and lets your team query data in plain language, without SQL, without waiting for an analyst, and without rebuilding semantic layers every time a field name changes. The AI Data Analyst answers questions in real time, while conversational analytics lets every team member explore data independently. For teams that need live data across all their tools, real-time analytics delivers current insights instead of yesterday's batch. If your organization is ready to move past static dashboards, Skopx offers a practical path forward.
FAQ
Why do traditional BI tools create such long delays?
Traditional BI tools rely on batch processing, which ingests and transforms data on a fixed schedule rather than continuously. This architecture creates a 4–7 day lag between a business question and a usable answer.
What causes low adoption rates in enterprise BI tools?
Complexity is the primary cause. 90% of BI licenses go unused because most business users lack the SQL and data modeling skills required to operate tools like Tableau or Power BI without analyst support.
What is a semantic layer and why does it break?
A semantic layer translates raw database fields into business-friendly report labels. In traditional BI, it is hand-coded and breaks whenever source data changes, such as a CRM field rename, requiring 2–4 weeks of manual reconstruction.
Does adding AI to a legacy BI dashboard fix the core problems?
No. Retrofitting AI onto legacy dashboards changes the interface but not the underlying data logic. Legacy architectures cannot dynamically correlate structured and unstructured data, which limits what AI can actually reason over.
What is the difference between traditional BI and modern AI analytics?
Traditional BI describes what happened using historical, batch-processed data. Modern AI analytics explains why it happened by correlating diverse data sources in real time and supporting conversational, self-service querying for all business roles.
Recommended
Skopx Team
The Skopx engineering and product team