How to Set Up Live Data Alerts for Analysts
Live data alerts are threshold-based notifications that fire automatically when a monitored metric crosses a defined condition in real time. For data analysts and BI professionals, they replace manual dashboard checks with a proactive system that surfaces problems the moment they appear. The standard industry term is "real-time alerting," and the practice of configuring it end to end is what most teams mean when they say they want to set up live data alerts for analysts. Done right, the system delivers sub-2-second latency for operational visibility and early incident detection. Done wrong, it buries your team in noise and erodes trust in every notification it sends.
How to set up live data alerts for analysts: tools and architecture
The architecture you choose determines everything about alert speed and reliability. Three delivery models dominate the field: polling, Server-Sent Events (SSE), and WebSockets. Each trades off latency, server load, and implementation complexity differently.
Polling queries a data source on a fixed schedule. Enterprise platforms like Databricks allow alert evaluations every 5 minutes, which works for non-urgent business metrics but fails for operational monitoring. Polling adds latency equal to half the interval on average, and it scales poorly under heavy query loads.

SSE holds an open HTTP connection and pushes updates from server to client as they happen. SSE architectures remove typical backend metrics storage and enable sub-second live data visualizations. This makes SSE the right choice for live dashboard updates where you need speed without the overhead of a full duplex connection.
WebSockets open a two-way channel between client and server. Push-based alert systems using WebSocket streaming deliver notifications in under 1 minute of threshold breaches during active monitoring. WebSockets suit high-frequency, bidirectional data flows like trading feeds or live sensor streams.
Notification delivery channels
Once data crosses a threshold, the alert needs a delivery path. The four standard channels are:
- Push notifications: Best for mobile or browser-based analyst tools. Low latency, high visibility.
- Email: Reliable for non-urgent alerts and audit trails. Avoid for sub-minute response requirements.
- SMS: Reserved for critical, high-priority conditions where email may be missed.
- Webhooks: Send structured payloads to Slack, PagerDuty, or any downstream system. Best for automated workflows.
Pro Tip: Match the channel to the urgency tier. A revenue anomaly at 2:00 AM belongs in SMS or a webhook to an on-call channel. A weekly trend deviation belongs in email.
Before any notification fires, data quality validation must pass. Five quality dimensions matter most: completeness, validity, uniqueness, timeliness, and consistency. Skipping this step means your alert system will fire on corrupt, delayed, or duplicate records.
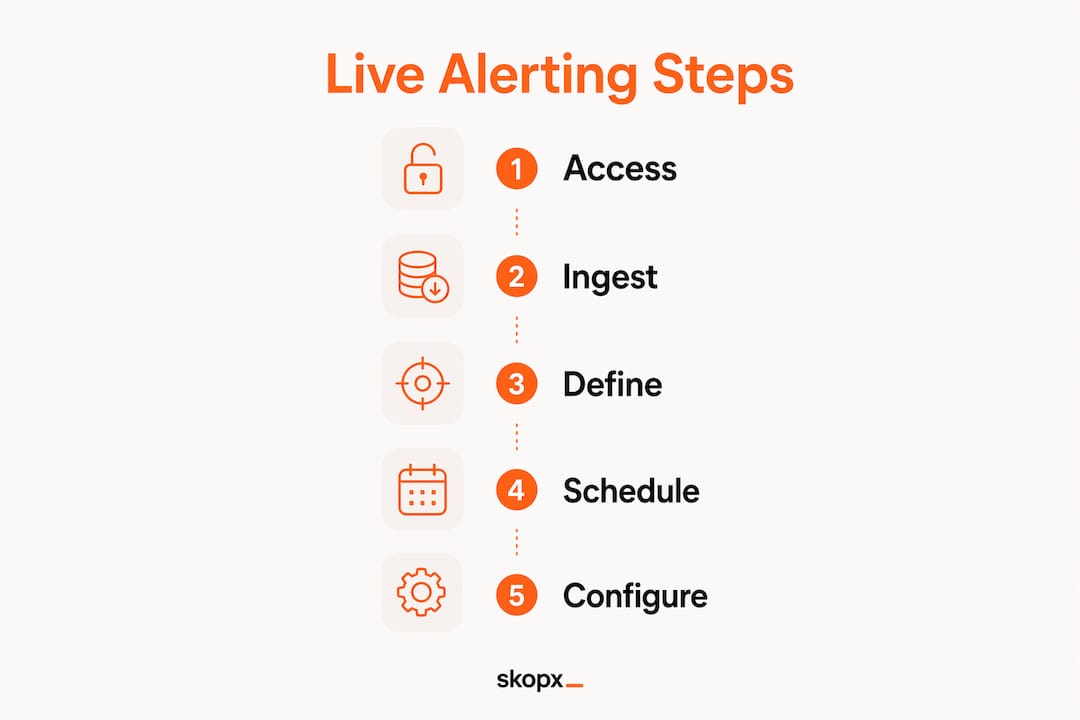
Step-by-step process to build a live alerting system
Building a reliable analyst notification system requires five clear stages. Each stage has defined inputs, outputs, and validation checks.
Step 1: Establish data source access
Confirm API keys, database credentials, and compute permissions before writing a single alert rule. Missing access at runtime is the most common reason alert pipelines fail silently. Document every data source endpoint and its expected refresh rate.
Step 2: Ingest and normalize live data
Connect your streaming source using WebSockets or SSE for low-latency feeds, or a scheduled query for batch-style monitoring. Normalize field names, timestamps, and data types at ingestion. Timestamp misalignment is a leading cause of false alerts, so enforce UTC across all sources.
Step 3: Define alert conditions and thresholds
Write conditions as precise logical expressions. "Revenue drops more than 15% versus the prior 7-day average" is a valid condition. "Revenue is low" is not. Use percentages and absolute values together for context. For context-aware thresholds, consider dynamic baselines that adjust to seasonal patterns rather than fixed cutoffs.
Step 4: Schedule and run alert queries
Set evaluation frequency based on the metric's business criticality. Operational metrics warrant streaming or sub-minute polling. Weekly KPIs can run every 15–30 minutes. Avoid evaluating every metric at the same interval. Staggering evaluations reduces database load and prevents query pile-ups.
Step 5: Configure recipients and test triggers
Assign each alert to a specific owner, not a generic team inbox. Generic routing delays response. Test every alert by injecting synthetic data that crosses the threshold. Confirm the notification arrives on the correct channel within the expected latency window.
| Stage | Input | Output | Validation check |
|---|---|---|---|
| Data ingestion | Raw stream or query result | Normalized records | Schema match, timestamp alignment |
| Quality validation | Normalized records | Clean, filtered dataset | Completeness, consistency, uniqueness |
| Threshold evaluation | Clean dataset | Boolean trigger signal | Condition logic review |
| Notification dispatch | Trigger signal | Alert sent to channel | Delivery confirmation log |
| Post-alert review | Delivery log | False positive rate | Weekly alert audit |
Pro Tip: Run a "chaos test" monthly. Deliberately feed bad data into your pipeline and confirm that quality checks block the alert from firing. If the alert fires anyway, your validation layer has a gap.
How do you reduce alert noise and improve signal quality?
Alert fatigue is the single biggest threat to a live alerting system. When analysts receive too many low-quality notifications, they stop reading them. The fix is not fewer alerts. It is better-designed alerts.
Alerting works best as a multi-stage decision pipeline with signal validation before user notification. That means every alert candidate passes through ingestion, quality checks, and condition logic before it reaches a human. Skipping any stage increases false positives.
A tiered alert structure separates noise from signal:
- Informational: Metric moved outside normal range. Log it. No notification required.
- Watchlist: Metric is trending toward a critical threshold. Notify the owning analyst via email or dashboard flag.
- Action-ready: Threshold breached. Immediate notification via push, SMS, or webhook to an on-call channel.
Debounce windows and cooldown periods are non-negotiable for volatile data. Setting cooldowns of 5–15 minutes after an alert fires prevents the same event from triggering repeated notifications. Without cooldowns, a single spike in a noisy metric can generate dozens of identical alerts in minutes.
Multi-factor conditions also reduce false positives. Instead of alerting on a single metric crossing a threshold, require two or more conditions to be true simultaneously. For example, alert only when session volume drops more than 20% AND error rate rises above 5%. This filters out coincidental fluctuations.
Categorizing alerts by type and applying tailored response plans to each category prevents analysts from treating every notification as equally urgent. A revenue anomaly and a data pipeline delay require different responses. Build that distinction into the alert design, not the analyst's judgment.
Pro Tip: Track your false positive rate weekly. If more than 20% of alerts require no action, your thresholds are too sensitive. Tighten conditions or raise the tier classification before the team stops trusting the system. For additional ideas on reducing irrelevant alerts, custom alert filtering by metric category is worth exploring.
What are the most common mistakes when configuring live alerts?
Most alert system failures trace back to a small set of repeatable mistakes. Knowing them in advance saves hours of debugging.
- Polling when you need streaming. Polling introduces latency and load that streaming avoids. If your alert must fire within seconds, polling at 5-minute intervals will always disappoint.
- Skipping data quality validation. Alerts built on unvalidated data fire on corrupt records, delayed feeds, and duplicate rows. A multi-stage validation pipeline is the only reliable defense.
- Using static thresholds on seasonal data. A 10% drop in traffic on a Tuesday looks different than the same drop on a holiday weekend. Static thresholds generate false positives during predictable fluctuations.
- Routing alerts to group inboxes. No one owns a group inbox. Alerts sent there get read late or ignored entirely.
- Ignoring total alert latency. Measure the full pipeline: data ingestion delay plus query evaluation time plus notification delivery. Each stage adds latency. True real-time monitoring requires sub-2-second total latency for operational use cases.
- No cooldown periods. Without debounce windows, a volatile metric generates alert storms that exhaust analyst attention within hours.
- Timestamp misalignment across sources. Joining streams with different time zones or clock drift produces phantom threshold breaches. Enforce UTC at ingestion.
The revenue anomaly detection patterns that work in production all share one trait: they validate data before evaluating conditions, not after.
Key Takeaways
Effective live data alerts require streaming architecture, multi-stage data validation, tiered alert classification, and cooldown periods to deliver accurate, low-noise notifications that analysts actually act on.
| Point | Details |
|---|---|
| Choose streaming over polling | WebSockets and SSE deliver sub-second alerts; polling adds avoidable latency. |
| Validate data before alerting | Check completeness, timeliness, and consistency to block false positives at the source. |
| Use tiered alert classification | Separate informational, watchlist, and action-ready alerts to match urgency to response. |
| Set cooldown periods | A 5–15 minute cooldown after each alert prevents duplicate notifications on volatile data. |
| Assign specific owners | Route every alert to a named analyst, not a group inbox, to guarantee a response. |
What most alert guides get wrong
The Skopx Team has worked with enough BI teams to see the same failure pattern repeat: analysts build alert rules before they build a data pipeline. They write a condition, attach a notification channel, and call it done. Then the alerts start firing on stale data, duplicate records, and timezone-shifted timestamps. Trust collapses within a week.
The mental model that actually works is to treat alerting as a pipeline problem, not a configuration problem. Every stage, from ingestion to validation to delivery, needs an owner, a test, and a fallback. The alert rule itself is the last thing you write, not the first.
Speed matters, but accuracy matters more. A system that fires in 30 seconds on bad data is worse than one that fires in 2 minutes on clean data. The teams that get this right build their quality checks first, then tune their latency. The teams that get it wrong do the opposite and spend months chasing phantom alerts.
Manual overrides are also underrated. Every alert system should allow an analyst to suppress a specific alert for a defined window without disabling the rule entirely. Planned maintenance, known data outages, and seasonal anomalies all produce legitimate threshold breaches that do not require a response. Without a suppression mechanism, analysts start ignoring alerts rather than managing them.
The best alert systems I have seen share one more trait: they are boring. No flashy dashboards, no complex ML models driving the thresholds. Just clean data, clear conditions, the right channel, and a named owner. Boring systems get trusted. Trusted systems get acted on.
Skopx Team
Skopx AI agents for live data alerting
Skopx connects to nearly 1,000 data integrations and lets analysts query live data through a conversational AI interface and get automated anomaly insights, without writing pipeline code from scratch.
The Skopx AI data agent connects your sources and watches key metrics for anomalies in one place. Analysts ask questions in plain language, and the insights engine flags anomalies automatically, surfacing them in the morning briefing. For teams that need a full automated data analysis platform, Skopx removes the infrastructure overhead so analysts can focus on the conditions that matter, not the plumbing that delivers them.
FAQ
What is the minimum latency for a real-time data alert?
True real-time monitoring requires sub-2-second total pipeline latency for operational use cases. Push-based systems using WebSocket streaming can deliver notifications in under 1 minute for most business monitoring scenarios.
What is the difference between SSE and WebSockets for live alerts?
SSE uses a one-way server-to-client connection and suits live dashboard updates with sub-second latency. WebSockets open a two-way channel and are better for high-frequency, bidirectional data feeds like trading or sensor streams.
How do you prevent alert fatigue when setting up live analytics notifications?
Set cooldown periods of 5–15 minutes after each alert fires, use tiered alert classification to separate informational from action-ready notifications, and require multi-factor conditions before triggering high-priority alerts.
Why do live data alerts fire on bad data?
Alerts fire on bad data when the pipeline skips quality validation before evaluating conditions. Checking completeness, timeliness, consistency, validity, and uniqueness at ingestion blocks corrupt or delayed records from reaching the alert rule.
How often should alert thresholds be reviewed?
Review thresholds at least monthly. Track your false positive rate weekly. If more than 20% of alerts require no action, tighten conditions or adjust tier classifications to restore analyst trust in the system.
Recommended
Share this article
Skopx Team
The Skopx engineering and product team