No-Code Data Exploration: A Plain-Language Guide

No-code data exploration is the process of analyzing and interpreting datasets through visual, AI-assisted interfaces that require no traditional programming skills. The industry term for the broader practice is self-service analytics, and no-code exploration sits at its most accessible end. Teams use techniques like drag-and-drop querying, natural language input, and automated anomaly detection to surface insights that once required a data engineer. No-code tools can cut dashboard build times dramatically compared to traditional BI tools. That gap explains why non-technical teams are adopting these platforms at a rapid pace.
What is no-code data exploration, and how does it work?
No-code data exploration connects four sequential stages: connection, querying, AI-assisted refinement, and export. Each stage uses a visual or conversational interface instead of written code. The result is a workflow any analyst, marketer, or operations manager can run without filing an IT ticket.

Stage 1: Connecting to your data sources
The first step is linking the platform to wherever your data lives. Modern no-code platforms connect to databases, spreadsheets, CRM systems, and cloud apps through pre-built connectors. Skopx, for example, connects to nearly 1,000 integrations, so teams rarely need to export files manually before exploring them.
Stage 2: Querying and filtering without SQL
Once connected, you query data using drag-and-drop fields or plain-English questions. You might type "show me sales by region for the last 90 days" and receive a filtered table instantly. This replaces the SQL knowledge that traditional analytics requires.
Stage 3: AI-assisted refinement
After the initial query, AI layers help you go deeper. The platform may suggest related trends, flag outliers, or propose a different grouping. Modern no-code platforms integrate from raw data to presentation-ready reports without stitching multiple tools together. Users typically generate presentation-ready insights within one day of initial setup.
Stage 4: Exporting and sharing results
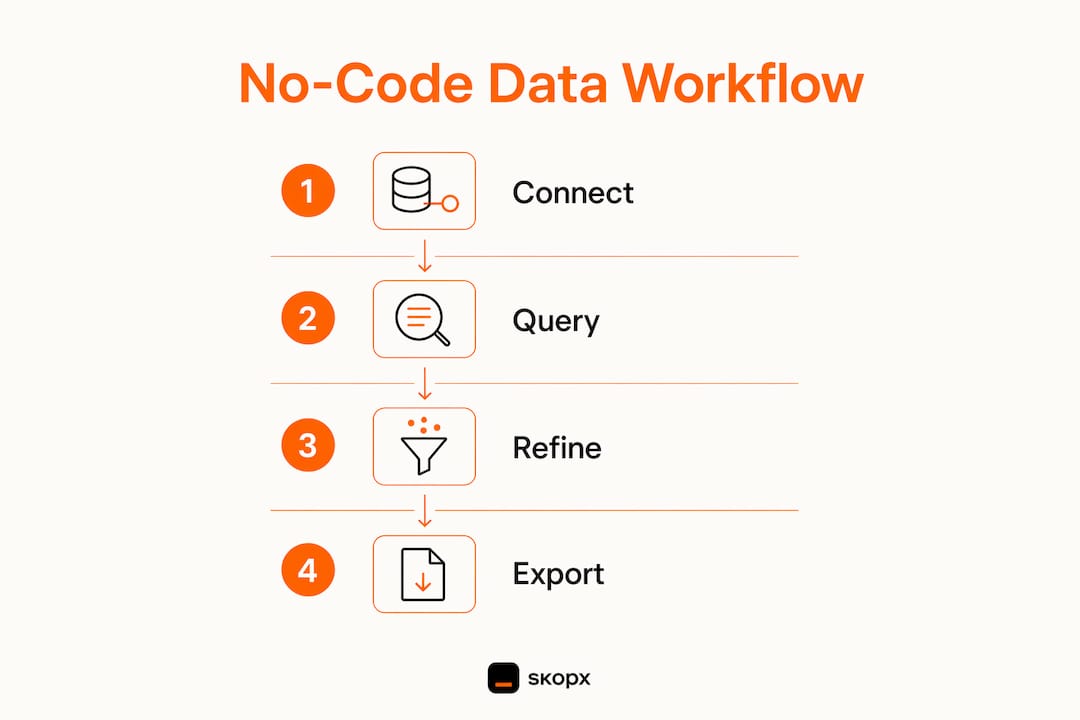
The final stage turns findings into shareable outputs: charts, dashboards, or exported files. Repeatable pipelines let you schedule the same exploration to run automatically each week.
Pro Tip: Before you connect your first data source, write down the specific question you want to answer. Teams that start with a clear question finish exploration faster and produce more reliable outputs.
How does no-code exploration differ from traditional BI and coding-based analytics?
Traditional business intelligence requires SQL knowledge, dedicated data teams, and often a formal ticketing process to get a new report built. No-code exploration removes those barriers. A marketing manager can answer her own question about campaign performance without waiting two weeks for a dashboard update.
The efficiency difference is real. No-code platforms handle large datasets instantly without requiring an external data warehouse. That means smaller teams can work with the same data volume that once demanded enterprise infrastructure.
| Feature | Traditional BI and coding | No-code exploration |
|---|---|---|
| User requirement | SQL or Python skills | Analytical thinking only |
| Setup time | Days to weeks | Hours to one day |
| Dataset handling | Requires data warehouse | Built-in, no warehouse needed |
| Report updates | IT ticket required | Self-service, on demand |
| Cost model | Per-seat licensing | Flat-rate pricing emerging |
No-code is not a replacement for every coding task. Complex statistical modeling, custom machine learning pipelines, and highly regulated data transformations still benefit from code. The right choice depends on the question you are asking, not the tool you prefer.
Pro Tip: Use no-code exploration for hypothesis testing and quick answers. Reserve your data engineering team's time for production pipelines and models that need version control and testing.
What role does AI and natural language processing play?
AI is what separates modern no-code exploration from older point-and-click BI tools. Natural language processing lets you ask questions in plain English and receive structured query results automatically. Natural language AI transforms data interaction from passive reporting to dynamic interrogation, surfacing statistical correlations and anomalies automatically. That shift means you spend less time building charts and more time acting on findings.
Conversational AI agents take this further by maintaining context across a session. Agentic platforms maintain conversation context across queries, enabling fluid and contextual analysis sessions. Thread memory means you can ask a follow-up question like "now break that down by product category" without re-entering your original filters.
Key AI capabilities in no-code exploration platforms include:
- Natural language querying: Type a question, receive a structured result without writing SQL.
- Anomaly detection: The platform flags unusual spikes or drops in your data automatically.
- Suggested insights: AI proposes related questions or trends you may not have thought to check.
- Conversational memory: Prior questions inform the context of follow-up queries.
- Semantic understanding: Better platforms use a data dictionary to interpret field names correctly.
One caution applies here. AI querying can hallucinate results when data semantics are poorly defined. A field named "rev" might mean revenue in one table and reviews in another. Investing in a data dictionary before you deploy an AI-powered exploration tool reduces these errors significantly. The upfront effort is small compared to the cost of acting on a wrong answer.
For teams that want to see cross-platform data insights in practice, real-world examples show how natural language interfaces surface findings that static dashboards miss entirely.
What skills do you actually need for no-code data exploration?
No-code does not mean no skill. The label removes the coding requirement, not the thinking requirement. Users require analytical thinking to properly define queries, filters, and validate outputs for trustworthy insights. A poorly framed question produces a technically correct but useless answer.
The skills that matter most are:
- Problem definition: State the business question clearly before opening any tool.
- Filter logic: Know which date ranges, segments, or conditions apply to your question.
- Output validation: Check that totals match known benchmarks before sharing results.
- Data literacy: Understand what each field represents and how it was collected.
- Skepticism: Treat AI-generated insights as hypotheses, not conclusions.
Building a data glossary for your team pays dividends quickly. A semantic layer reduces AI hallucinations and ensures consistent terminology across the platform. When every team member uses the same definition for "active customer," the AI produces consistent results across sessions.
Pro Tip: After every exploration session, document what you found and what you ruled out. This creates a shared knowledge base that prevents other team members from repeating the same analysis.
No-code exploration also benefits from understanding AI reporting automation, which extends the same logic to scheduled outputs and recurring reports.
How can teams apply no-code data exploration in daily workflows?
The most effective teams treat exploration as a distinct phase that comes before formal reporting. Exploration is the crucial sandbox phase before formal dashboard reporting, where assumptions are validated and trends spotted to avoid later dashboard failures. Skipping this phase is the most common reason dashboards get rebuilt weeks after launch.
A practical integration looks like this:
- Define the question. Write one sentence describing what you want to know before opening the tool.
- Connect and filter. Pull in the relevant data source and apply the date range or segment that matches your question.
- Explore and iterate. Run multiple queries, follow AI suggestions, and document what you find and what you discard.
- Validate outputs. Cross-check key numbers against a known source, such as a prior report or a finance-approved figure.
- Share or automate. Export findings to a shared workspace or set up a repeatable pipeline for recurring questions.
Across business functions, the use cases are wide. Sales teams explore pipeline data to spot stalled deals. Marketing teams analyze campaign performance by channel. Operations teams track process metrics without waiting for a weekly report. Finance teams validate budget assumptions before presenting to leadership. Each of these workflows benefits from self-service analytics that puts the question and the answer in the same hands.
Collaborative features matter here too. When exploration results are shareable within the platform, teams align faster. One person's finding becomes the starting point for another person's deeper question, which is how data-driven cultures actually form.
Key Takeaways
No-code data exploration delivers the fastest path from raw data to a validated business insight when teams combine the right tools with clear analytical thinking.
| Point | Details |
|---|---|
| Four-stage workflow | Connect, query, refine with AI, then export. Each stage requires no code. |
| Efficiency over traditional BI | No-code platforms sharply cut dashboard build times and eliminate IT ticket delays. |
| AI needs a data dictionary | Define your data semantics upfront to prevent AI from returning misleading results. |
| Analytical thinking still required | No-code removes the coding barrier, not the need to frame questions and validate outputs. |
| Exploration precedes reporting | Treat exploration as a sandbox phase to validate assumptions before building dashboards. |
The shift I keep watching in no-code data exploration
The most underrated change in no-code data exploration is not the drag-and-drop interface. It is the move from static charts to conversational, context-aware analysis. When a platform remembers what you asked three questions ago and uses that context to refine the next answer, the experience stops feeling like a tool and starts feeling like a thinking partner.
What concerns me is the gap between tool ease and user responsibility. Teams adopt no-code platforms quickly, then trust AI outputs without validating them. I have seen marketing teams make budget decisions based on a hallucinated correlation that no one checked against a second source. The tool was not at fault. The process was.
The teams that get the most value from no-code exploration are the ones that treat it like a scientific method. They form a hypothesis, run the query, check the result, and document what they found. They also invest in data dictionaries before they need them, not after the first bad insight causes a problem.
The next wave of these platforms will feature AI agents with persistent memory and collaborative interfaces where multiple team members explore the same dataset simultaneously. That is genuinely exciting. But the organizations that benefit most will be the ones that build analytical discipline alongside the tool adoption, not as an afterthought.
Skopx Team
How Skopx supports no-code data exploration and AI-assisted analytics
Skopx brings together AI-driven analysis and no-code workflows in a single interface that connects to nearly 1,000 data sources. Teams can ask questions in plain English, receive instant answers, and automate recurring analysis without writing a line of code.
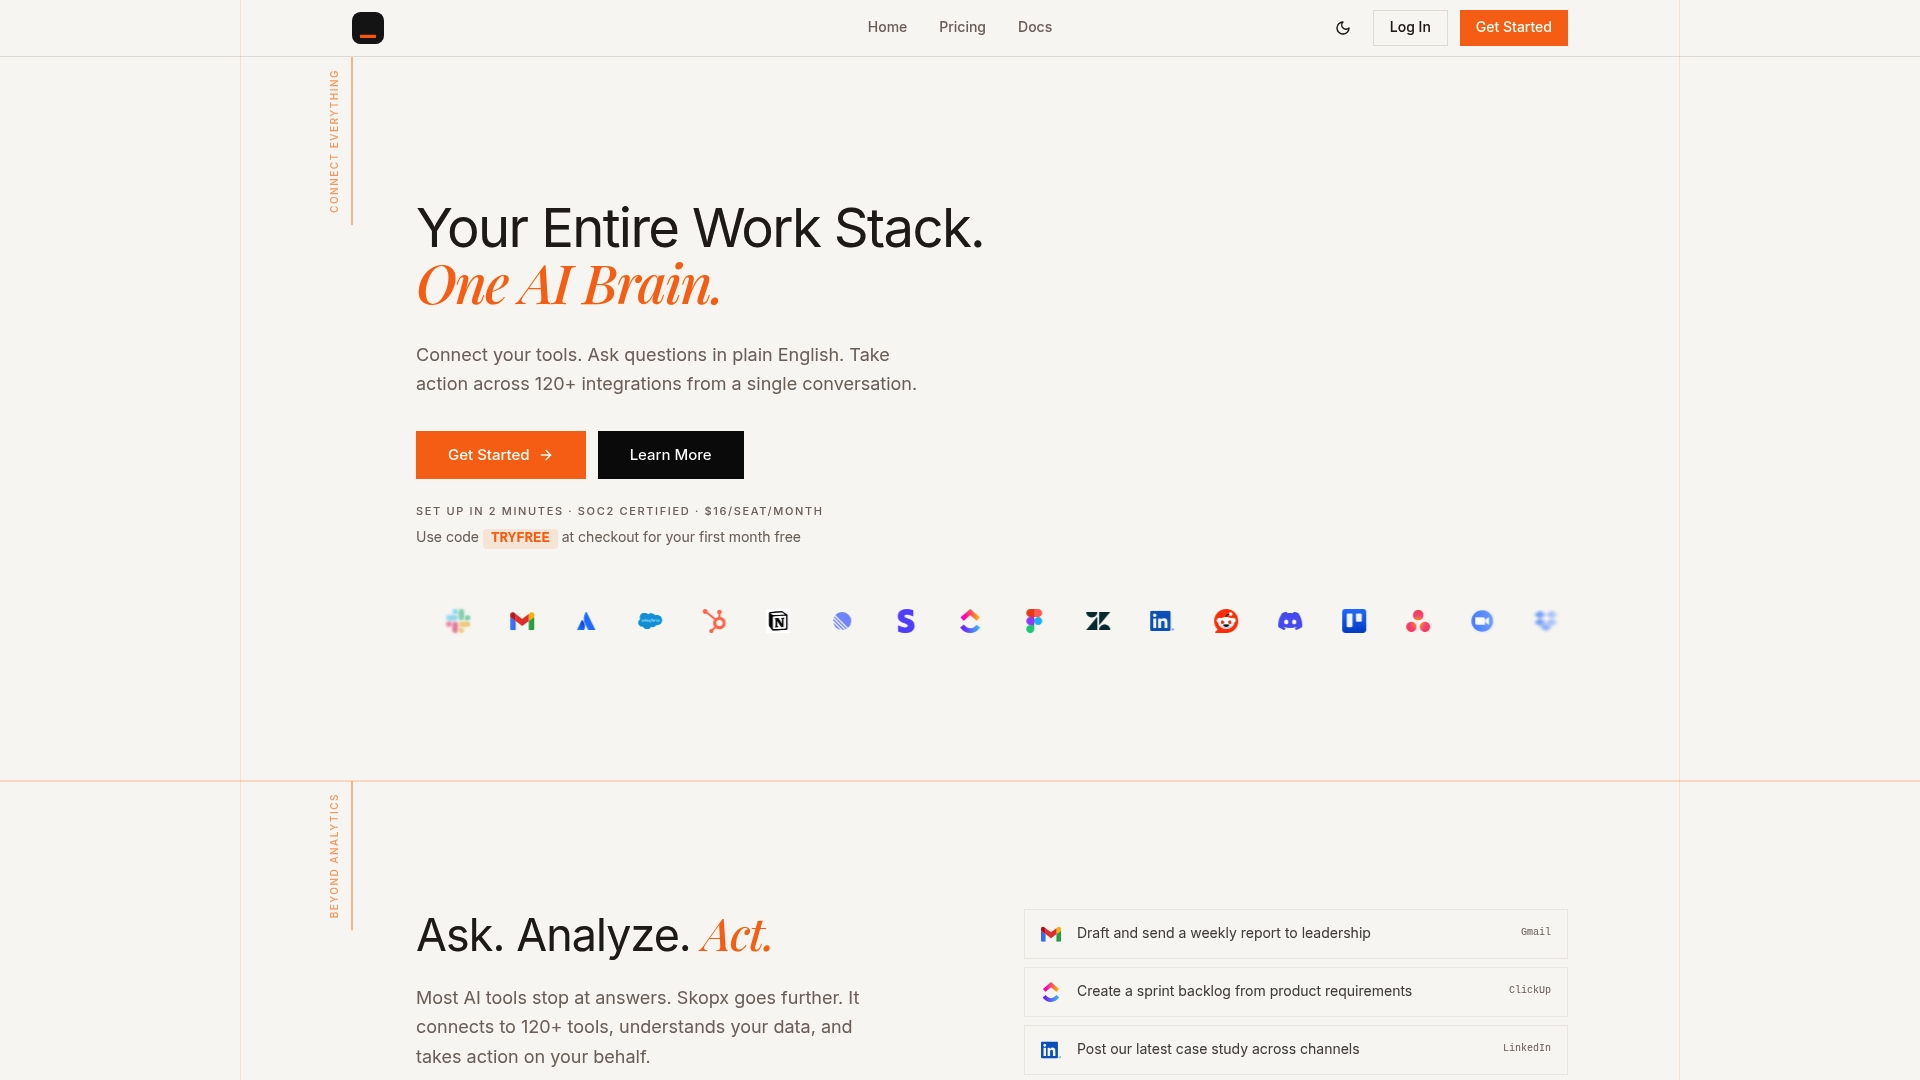
The Skopx AI Data Analyst handles complex queries across multiple platforms simultaneously, so you spend less time switching between tools and more time acting on findings. Skopx also surfaces automated insights from your connected data, flagging anomalies and unusual changes so they get a second look before they reach a report. Both are designed for teams that want the speed of no-code exploration without sacrificing accuracy.
FAQ
What is no-code data exploration?
No-code data exploration is the practice of analyzing datasets using visual interfaces, drag-and-drop querying, and natural language input without writing code. It is the most accessible form of self-service analytics.
How does no-code data analysis differ from traditional BI?
Traditional BI requires SQL skills and IT support to build or update reports. No-code data analysis lets non-technical users query data and generate insights independently, reducing wait times significantly.
Do I need any technical skills to explore data without code?
You do not need coding skills, but analytical thinking is required. Defining clear questions, applying correct filters, and validating AI outputs are all critical to getting reliable results.
Can AI hallucinate results in no-code exploration tools?
Yes. AI querying produces inaccurate results when data field names are ambiguous or undefined. Building a data dictionary before deploying an AI-powered platform reduces this risk substantially.
What is the best way to start with no-code analytics?
Start by writing down one specific business question, connect only the data source relevant to that question, and validate your first result against a known benchmark before sharing it with your team.
Recommended
Share this article
Skopx Team
The Skopx engineering and product team